|
Download Data (XLS File) |
|
||||||||
|
||||||||
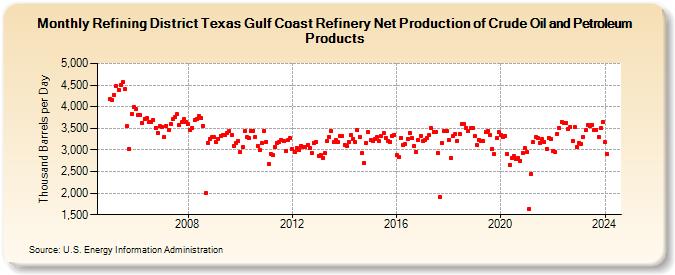
| Refining District Texas Gulf Coast Refinery Net Production of Crude Oil and Petroleum Products (Thousand Barrels per Day) | ||||||||
| Year | Jan | Feb | Mar | Apr | May | Jun | Jul | Aug | Sep | Oct | Nov | Dec |
|---|---|---|---|---|---|---|---|---|---|---|---|---|
| 2005 | 4,173 | 4,160 | 4,278 | 4,478 | 4,394 | 4,506 | 4,562 | 4,399 | 3,547 | 3,020 | 3,834 | 4,003 |
| 2006 | 3,938 | 3,813 | 3,804 | 3,634 | 3,720 | 3,732 | 3,640 | 3,649 | 3,695 | 3,514 | 3,402 | 3,553 |
| 2007 | 3,526 | 3,310 | 3,560 | 3,461 | 3,601 | 3,706 | 3,753 | 3,821 | 3,570 | 3,635 | 3,709 | 3,641 |
| 2008 | 3,595 | 3,460 | 3,508 | 3,695 | 3,717 | 3,785 | 3,738 | 3,550 | 1,996 | 3,169 | 3,255 | 3,299 |
| 2009 | 3,292 | 3,188 | 3,263 | 3,332 | 3,343 | 3,334 | 3,402 | 3,430 | 3,335 | 3,101 | 3,167 | 3,203 |
| 2010 | 2,954 | 3,056 | 3,443 | 3,288 | 3,268 | 3,429 | 3,447 | 3,303 | 3,099 | 2,995 | 3,149 | 3,438 |
| 2011 | 3,191 | 2,669 | 2,911 | 2,877 | 3,077 | 3,170 | 3,194 | 3,233 | 3,200 | 2,974 | 3,231 | 3,266 |
| 2012 | 3,026 | 2,942 | 3,048 | 3,008 | 3,097 | 3,074 | 3,078 | 3,121 | 3,054 | 2,927 | 3,153 | 3,176 |
| 2013 | 2,859 | 2,889 | 2,815 | 2,917 | 3,200 | 3,290 | 3,440 | 3,181 | 3,222 | 3,187 | 3,331 | 3,328 |
| 2014 | 3,119 | 3,099 | 3,173 | 3,337 | 3,247 | 3,176 | 3,451 | 3,310 | 2,922 | 2,699 | 3,164 | 3,417 |
| 2015 | 3,223 | 3,209 | 3,254 | 3,287 | 3,198 | 3,312 | 3,385 | 3,285 | 3,212 | 3,192 | 3,322 | 3,355 |
| 2016 | 2,876 | 2,834 | 3,279 | 3,117 | 3,130 | 3,254 | 3,402 | 3,281 | 3,096 | 2,952 | 3,223 | 3,333 |
| 2017 | 3,199 | 3,229 | 3,280 | 3,335 | 3,503 | 3,420 | 3,421 | 2,930 | 1,912 | 3,171 | 3,444 | 3,432 |
| 2018 | 3,236 | 2,823 | 3,325 | 3,370 | 3,214 | 3,367 | 3,589 | 3,608 | 3,517 | 3,441 | 3,500 | 3,496 |
| 2019 | 3,313 | 3,117 | 3,235 | 3,196 | 3,211 | 3,421 | 3,433 | 3,346 | 3,029 | 2,899 | 3,272 | 3,413 |
| 2020 | 3,340 | 3,295 | 3,327 | 2,904 | 2,659 | 2,807 | 2,857 | 2,783 | 2,823 | 2,752 | 2,937 | 3,037 |
| 2021 | 2,941 | 1,641 | 2,432 | 3,179 | 3,298 | 3,272 | 3,171 | 3,242 | 3,186 | 3,030 | 3,276 | 3,247 |
| 2022 | 2,979 | 2,950 | 3,379 | 3,500 | 3,649 | 3,616 | 3,632 | 3,489 | 3,531 | 3,215 | 3,524 | 3,070 |
| 2023 | 3,170 | 3,147 | 3,304 | 3,450 | 3,568 | 3,552 | 3,586 | 3,455 | 3,463 | 3,299 | 3,497 | 3,657 |
| 2024 | 3,180 | 2,903 | ||||||||||
| - = No Data Reported; -- = Not Applicable; NA = Not Available; W = Withheld to avoid disclosure of individual company data. |
| Release Date: 4/30/2024 |
| Next Release Date: 5/31/2024 |