|
Download Data (XLS File) |
|
||||||||
|
||||||||
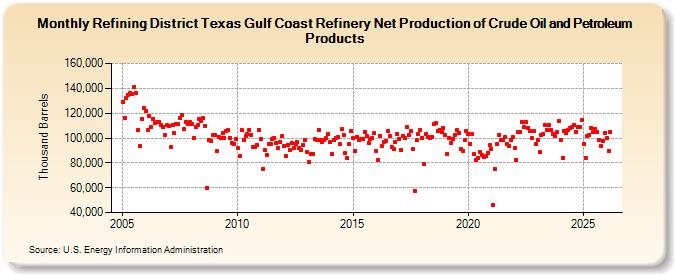
| Refining District Texas Gulf Coast Refinery Net Production of Crude Oil and Petroleum Products (Thousand Barrels) | ||||||||
| Year | Jan | Feb | Mar | Apr | May | Jun | Jul | Aug | Sep | Oct | Nov | Dec |
|---|---|---|---|---|---|---|---|---|---|---|---|---|
| 2005 | 129,357 | 116,482 | 132,613 | 134,354 | 136,209 | 135,193 | 141,411 | 136,355 | 106,407 | 93,631 | 115,019 | 124,083 |
| 2006 | 122,084 | 106,775 | 117,937 | 109,009 | 115,325 | 111,963 | 112,854 | 113,122 | 110,863 | 108,922 | 102,059 | 110,150 |
| 2007 | 109,318 | 92,685 | 110,346 | 103,837 | 111,635 | 111,187 | 116,344 | 118,437 | 107,101 | 112,694 | 111,257 | 112,879 |
| 2008 | 111,457 | 100,326 | 108,752 | 110,861 | 115,214 | 113,554 | 115,868 | 110,043 | 59,887 | 98,239 | 97,658 | 102,276 |
| 2009 | 102,067 | 89,277 | 101,162 | 99,958 | 103,647 | 100,014 | 105,466 | 106,315 | 100,035 | 96,137 | 94,996 | 99,296 |
| 2010 | 91,587 | 85,566 | 106,723 | 98,641 | 101,294 | 102,872 | 106,850 | 102,379 | 92,983 | 92,848 | 94,479 | 106,575 |
| 2011 | 98,916 | 74,727 | 90,233 | 86,319 | 95,389 | 95,108 | 99,014 | 100,217 | 95,985 | 92,208 | 96,930 | 101,237 |
| 2012 | 93,809 | 85,304 | 94,498 | 90,245 | 96,010 | 92,225 | 95,429 | 96,764 | 91,623 | 90,729 | 94,593 | 98,446 |
| 2013 | 88,617 | 80,881 | 87,277 | 87,498 | 99,208 | 98,706 | 106,631 | 98,617 | 96,655 | 98,801 | 99,942 | 103,161 |
| 2014 | 96,694 | 86,764 | 98,350 | 100,099 | 100,670 | 95,293 | 106,989 | 102,604 | 87,672 | 83,663 | 94,913 | 105,936 |
| 2015 | 99,899 | 89,838 | 100,874 | 98,597 | 99,145 | 99,350 | 104,937 | 101,820 | 96,345 | 98,960 | 99,672 | 104,011 |
| 2016 | 89,155 | 82,199 | 101,634 | 93,517 | 97,033 | 97,605 | 105,466 | 101,707 | 92,866 | 91,506 | 96,691 | 103,326 |
| 2017 | 99,160 | 90,409 | 101,671 | 100,057 | 108,605 | 102,593 | 106,042 | 90,831 | 57,360 | 98,295 | 103,313 | 106,401 |
| 2018 | 100,307 | 79,051 | 103,084 | 101,097 | 99,619 | 101,000 | 111,254 | 111,852 | 105,519 | 106,683 | 105,000 | 108,366 |
| 2019 | 102,711 | 87,271 | 100,293 | 95,878 | 99,551 | 102,618 | 106,432 | 103,717 | 90,864 | 89,855 | 98,146 | 105,801 |
| 2020 | 103,536 | 95,547 | 103,143 | 87,125 | 82,422 | 84,218 | 88,552 | 86,268 | 84,704 | 85,322 | 88,124 | 94,133 |
| 2021 | 91,178 | 45,947 | 75,406 | 95,380 | 102,228 | 98,163 | 98,310 | 100,512 | 95,580 | 93,933 | 98,284 | 100,645 |
| 2022 | 92,334 | 82,599 | 104,744 | 105,001 | 113,121 | 108,478 | 112,592 | 108,159 | 105,925 | 99,654 | 105,726 | 95,170 |
| 2023 | 98,266 | 88,127 | 102,425 | 103,501 | 110,622 | 106,560 | 111,158 | 107,107 | 103,897 | 102,256 | 104,906 | 113,352 |
| 2024 | 98,589 | |||||||||||
| - = No Data Reported; -- = Not Applicable; NA = Not Available; W = Withheld to avoid disclosure of individual company data. |
| Release Date: 3/29/2024 |
| Next Release Date: 4/30/2024 |