|
Download Data (XLS File) |
|
||||||||
|
||||||||
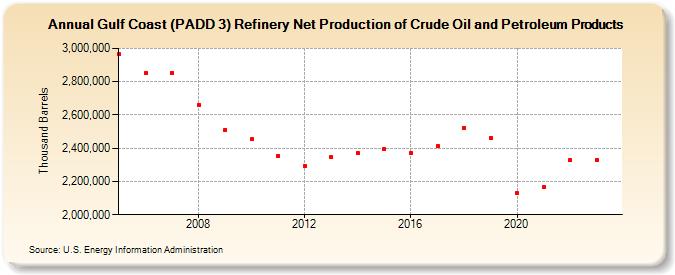
| Gulf Coast (PADD 3) Refinery Net Production of Crude Oil and Petroleum Products (Thousand Barrels) | ||||||||
| Decade | Year-0 | Year-1 | Year-2 | Year-3 | Year-4 | Year-5 | Year-6 | Year-7 | Year-8 | Year-9 |
|---|---|---|---|---|---|---|---|---|---|---|
| 2000's | 2,963,869 | 2,853,479 | 2,854,309 | 2,662,471 | 2,512,148 | |||||
| 2010's | 2,452,661 | 2,353,545 | 2,293,623 | 2,344,462 | 2,370,267 | 2,392,855 | 2,372,070 | 2,412,935 | 2,523,077 | 2,463,641 |
| 2020's | 2,128,201 | 2,164,257 | 2,328,514 | 2,331,204 |
| - = No Data Reported; -- = Not Applicable; NA = Not Available; W = Withheld to avoid disclosure of individual company data. |
| Release Date: 3/29/2024 |
| Next Release Date: 8/30/2024 |