|
Download Data (XLS File) |
|
||||||||
|
||||||||
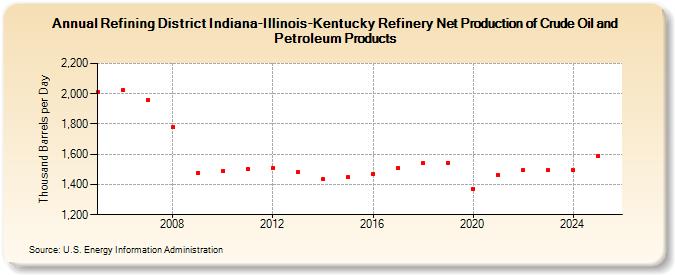
| Refining District Indiana-Illinois-Kentucky Refinery Net Production of Crude Oil and Petroleum Products (Thousand Barrels per Day) | ||||||||
| Decade | Year-0 | Year-1 | Year-2 | Year-3 | Year-4 | Year-5 | Year-6 | Year-7 | Year-8 | Year-9 |
|---|---|---|---|---|---|---|---|---|---|---|
| 2000's | 2,009 | 2,024 | 1,960 | 1,779 | 1,477 | |||||
| 2010's | 1,492 | 1,501 | 1,512 | 1,480 | 1,435 | 1,447 | 1,469 | 1,511 | 1,539 | 1,545 |
| 2020's | 1,372 | 1,465 | 1,493 | 1,493 |
| - = No Data Reported; -- = Not Applicable; NA = Not Available; W = Withheld to avoid disclosure of individual company data. |
| Release Date: 3/29/2024 |
| Next Release Date: 8/30/2024 |