|
Download Data (XLS File) |
|
||||||||
|
||||||||
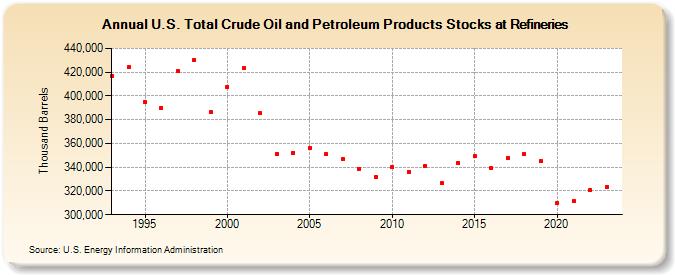
| U.S. Total Crude Oil and Petroleum Products Stocks at Refineries (Thousand Barrels) | ||||||||
| Decade | Year-0 | Year-1 | Year-2 | Year-3 | Year-4 | Year-5 | Year-6 | Year-7 | Year-8 | Year-9 |
|---|---|---|---|---|---|---|---|---|---|---|
| 1990's | 416,883 | 424,060 | 395,267 | 390,028 | 420,894 | 430,578 | 386,225 | |||
| 2000's | 407,543 | 423,194 | 385,775 | 351,409 | 352,178 | 356,569 | 351,127 | 346,915 | 338,782 | 331,615 |
| 2010's | 339,907 | 336,327 | 341,211 | 326,400 | 343,792 | 349,271 | 339,059 | 348,006 | 351,003 | 345,417 |
| 2020's | 309,541 | 311,641 | 320,754 | 323,410 |
| - = No Data Reported; -- = Not Applicable; NA = Not Available; W = Withheld to avoid disclosure of individual company data. |
| Release Date: 4/30/2024 |
| Next Release Date: 8/30/2024 |