|
Download Data (XLS File) |
|
||||||||
|
||||||||
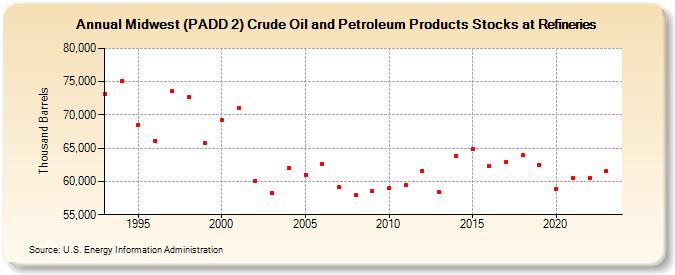
| Midwest (PADD 2) Crude Oil and Petroleum Products Stocks at Refineries (Thousand Barrels) | ||||||||
| Decade | Year-0 | Year-1 | Year-2 | Year-3 | Year-4 | Year-5 | Year-6 | Year-7 | Year-8 | Year-9 |
|---|---|---|---|---|---|---|---|---|---|---|
| 1990's | 73,180 | 75,081 | 68,537 | 66,152 | 73,622 | 72,730 | 65,748 | |||
| 2000's | 69,200 | 71,047 | 60,112 | 58,321 | 62,036 | 61,029 | 62,664 | 59,234 | 57,949 | 58,501 |
| 2010's | 59,019 | 59,528 | 61,587 | 58,476 | 63,869 | 64,834 | 62,306 | 62,909 | 63,952 | 62,521 |
| 2020's | 58,839 | 60,516 | 60,563 | 61,548 |
| - = No Data Reported; -- = Not Applicable; NA = Not Available; W = Withheld to avoid disclosure of individual company data. |
| Release Date: 3/29/2024 |
| Next Release Date: 8/30/2024 |