|
Download Data (XLS File) |
|
||||||||
|
||||||||
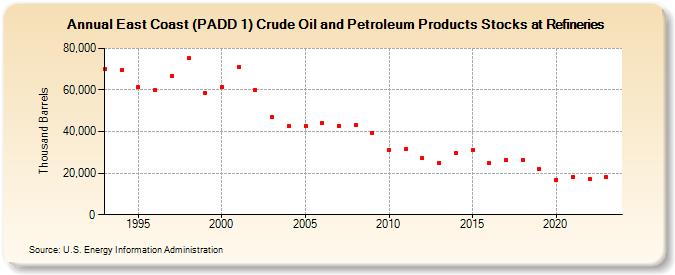
| East Coast (PADD 1) Crude Oil and Petroleum Products Stocks at Refineries (Thousand Barrels) | ||||||||
| Decade | Year-0 | Year-1 | Year-2 | Year-3 | Year-4 | Year-5 | Year-6 | Year-7 | Year-8 | Year-9 |
|---|---|---|---|---|---|---|---|---|---|---|
| 1990's | 70,212 | 69,806 | 61,282 | 59,923 | 66,718 | 75,241 | 58,715 | |||
| 2000's | 61,421 | 71,164 | 60,091 | 46,767 | 42,613 | 42,717 | 44,283 | 42,889 | 42,986 | 39,447 |
| 2010's | 31,058 | 31,590 | 27,226 | 25,054 | 29,578 | 31,218 | 24,826 | 26,500 | 26,456 | 21,969 |
| 2020's | 16,861 | 17,937 | 17,385 | 18,065 |
| - = No Data Reported; -- = Not Applicable; NA = Not Available; W = Withheld to avoid disclosure of individual company data. |
| Release Date: 3/29/2024 |
| Next Release Date: 8/30/2024 |