|
Download Data (XLS File) |
|
||||||||
|
||||||||
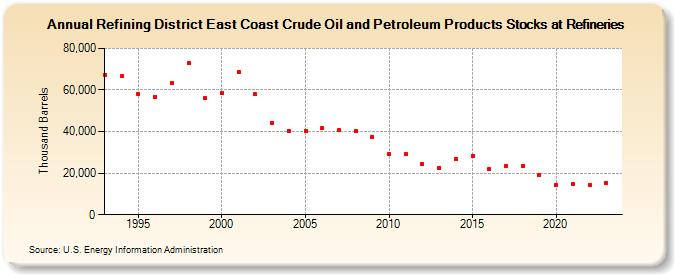
| Refining District East Coast Crude Oil and Petroleum Products Stocks at Refineries (Thousand Barrels) | ||||||||
| Decade | Year-0 | Year-1 | Year-2 | Year-3 | Year-4 | Year-5 | Year-6 | Year-7 | Year-8 | Year-9 |
|---|---|---|---|---|---|---|---|---|---|---|
| 1990's | 67,186 | 66,555 | 57,975 | 56,812 | 63,575 | 72,973 | 56,003 | |||
| 2000's | 58,590 | 68,709 | 57,860 | 44,284 | 40,313 | 40,271 | 41,521 | 40,580 | 40,299 | 37,497 |
| 2010's | 28,994 | 29,355 | 24,489 | 22,644 | 26,915 | 28,378 | 21,888 | 23,406 | 23,434 | 19,079 |
| 2020's | 14,235 | 14,978 | 14,499 | 15,221 |
| - = No Data Reported; -- = Not Applicable; NA = Not Available; W = Withheld to avoid disclosure of individual company data. |
| Release Date: 3/29/2024 |
| Next Release Date: 8/30/2024 |