|
Download Data (XLS File) |
|
||||||||
|
||||||||
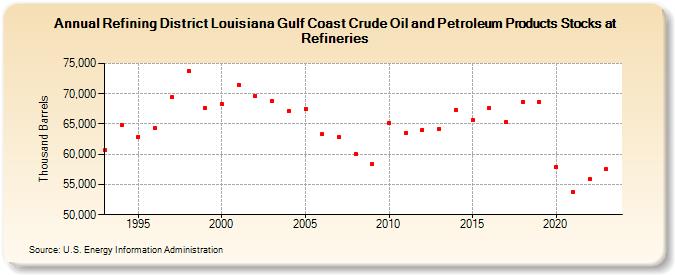
| Refining District Louisiana Gulf Coast Crude Oil and Petroleum Products Stocks at Refineries (Thousand Barrels) | ||||||||
| Decade | Year-0 | Year-1 | Year-2 | Year-3 | Year-4 | Year-5 | Year-6 | Year-7 | Year-8 | Year-9 |
|---|---|---|---|---|---|---|---|---|---|---|
| 1990's | 60,627 | 64,868 | 62,893 | 64,258 | 69,414 | 73,819 | 67,689 | |||
| 2000's | 68,266 | 71,514 | 69,700 | 68,879 | 67,177 | 67,541 | 63,284 | 62,792 | 60,068 | 58,326 |
| 2010's | 65,182 | 63,530 | 64,067 | 64,187 | 67,354 | 65,637 | 67,610 | 65,342 | 68,603 | 68,604 |
| 2020's | 57,934 | 53,826 | 55,867 | 57,479 |
| - = No Data Reported; -- = Not Applicable; NA = Not Available; W = Withheld to avoid disclosure of individual company data. |
| Release Date: 4/30/2024 |
| Next Release Date: 8/30/2024 |