|
Download Data (XLS File) |
|
||||||||
|
||||||||
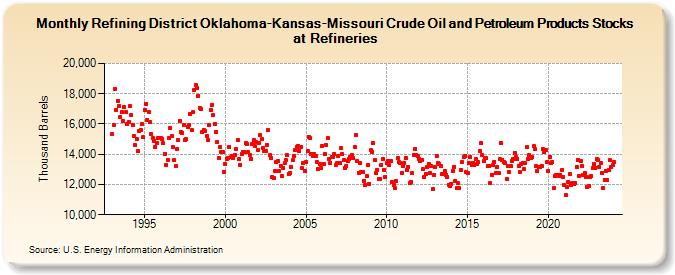
| Refining District Oklahoma-Kansas-Missouri Crude Oil and Petroleum Products Stocks at Refineries (Thousand Barrels) | ||||||||
| Year | Jan | Feb | Mar | Apr | May | Jun | Jul | Aug | Sep | Oct | Nov | Dec |
|---|---|---|---|---|---|---|---|---|---|---|---|---|
| 1993 | 15,321 | 15,933 | 18,338 | 16,936 | 17,545 | 17,197 | 16,485 | 16,768 | 16,189 | 17,122 | 16,785 | 16,006 |
| 1994 | 16,124 | 17,170 | 16,616 | 15,958 | 15,228 | 14,595 | 15,005 | 14,188 | 15,520 | 15,613 | 15,996 | 15,119 |
| 1995 | 16,945 | 17,338 | 16,279 | 16,775 | 16,130 | 15,351 | 15,041 | 14,885 | 14,479 | 14,717 | 15,089 | 15,083 |
| 1996 | 15,062 | 15,003 | 14,721 | 14,035 | 13,318 | 13,638 | 15,054 | 15,748 | 15,179 | 14,460 | 13,589 | 13,221 |
| 1997 | 14,340 | 14,928 | 16,222 | 15,474 | 15,410 | 15,908 | 14,945 | 14,976 | 15,809 | 15,955 | 16,656 | 15,601 |
| 1998 | 16,762 | 18,279 | 18,597 | 18,364 | 17,870 | 17,059 | 16,970 | 15,486 | 15,626 | 15,527 | 15,189 | 14,930 |
| 1999 | 15,902 | 16,912 | 17,265 | 16,587 | 16,025 | 15,495 | 14,820 | 13,726 | 14,464 | 14,122 | 14,173 | 12,849 |
| 2000 | 13,325 | 13,713 | 13,732 | 14,485 | 13,807 | 13,866 | 13,737 | 13,978 | 14,360 | 14,971 | 13,654 | 13,316 |
| 2001 | 14,006 | 14,139 | 14,121 | 14,734 | 14,646 | 14,124 | 13,967 | 13,695 | 14,706 | 14,922 | 14,533 | 14,803 |
| 2002 | 14,277 | 14,721 | 15,242 | 14,985 | 14,434 | 14,188 | 14,204 | 14,615 | 15,574 | 13,929 | 13,732 | 12,481 |
| 2003 | 12,402 | 12,895 | 13,463 | 13,578 | 12,862 | 13,238 | 12,566 | 13,108 | 13,394 | 13,597 | 13,945 | 12,698 |
| 2004 | 12,755 | 13,178 | 13,593 | 13,900 | 14,296 | 14,497 | 14,563 | 14,207 | 14,491 | 13,082 | 13,426 | 12,891 |
| 2005 | 13,488 | 14,208 | 15,171 | 15,076 | 14,013 | 13,881 | 14,004 | 13,863 | 13,475 | 13,035 | 13,358 | 13,062 |
| 2006 | 14,533 | 13,385 | 14,015 | 14,607 | 15,080 | 13,661 | 13,425 | 13,791 | 13,830 | 14,016 | 13,268 | 13,390 |
| 2007 | 13,878 | 13,407 | 14,400 | 14,031 | 13,601 | 13,092 | 13,243 | 13,549 | 13,671 | 13,817 | 13,928 | 13,748 |
| 2008 | 14,507 | 15,267 | 13,563 | 12,776 | 13,404 | 12,808 | 12,844 | 12,260 | 11,996 | 12,551 | 13,280 | 12,039 |
| 2009 | 14,261 | 14,145 | 14,741 | 13,610 | 12,783 | 12,969 | 12,380 | 12,363 | 13,319 | 13,686 | 12,971 | 12,479 |
| 2010 | 13,404 | 13,564 | 13,258 | 13,530 | 12,194 | 11,994 | 11,743 | 12,211 | 13,761 | 13,489 | 13,419 | 12,790 |
| 2011 | 13,212 | 13,430 | 13,770 | 12,926 | 13,125 | 12,070 | 12,194 | 12,755 | 13,935 | 14,368 | 13,965 | 13,885 |
| 2012 | 13,695 | 13,577 | 13,611 | 13,022 | 12,492 | 12,708 | 13,144 | 13,334 | 12,737 | 13,192 | 11,695 | 12,658 |
| 2013 | 13,141 | 13,914 | 13,407 | 13,358 | 13,227 | 12,662 | 12,680 | 12,888 | 12,622 | 12,497 | 11,997 | 11,872 |
| 2014 | 12,051 | 12,899 | 13,163 | 12,222 | 11,748 | 12,090 | 11,744 | 12,966 | 13,463 | 13,799 | 13,869 | 12,837 |
| 2015 | 12,769 | 13,419 | 13,809 | 13,258 | 13,438 | 13,257 | 13,652 | 13,327 | 13,481 | 14,183 | 14,714 | 13,966 |
| 2016 | 13,534 | 13,750 | 13,722 | 13,233 | 13,195 | 12,079 | 12,641 | 13,261 | 13,506 | 12,750 | 13,171 | 12,789 |
| 2017 | 13,656 | 14,735 | 13,646 | 13,478 | 13,404 | 12,393 | 13,227 | 12,827 | 13,231 | 13,550 | 13,677 | 14,102 |
| 2018 | 13,815 | 13,685 | 13,227 | 12,817 | 13,324 | 13,435 | 13,001 | 13,387 | 14,485 | 13,682 | 13,940 | 13,718 |
| 2019 | 13,800 | 14,516 | 14,354 | 13,214 | 12,894 | 13,146 | 13,177 | 13,235 | 14,323 | 14,153 | 14,273 | 13,455 |
| 2020 | 12,923 | 13,789 | 13,413 | 13,506 | 11,796 | 12,581 | 12,595 | 12,626 | 12,575 | 12,658 | 12,945 | 12,472 |
| 2021 | 11,933 | 11,294 | 11,824 | 12,179 | 12,684 | 11,939 | 12,069 | 12,017 | 12,122 | 13,186 | 13,631 | 12,552 |
| 2022 | 13,519 | 13,244 | 12,606 | 12,758 | 12,520 | 11,848 | 11,914 | 12,513 | 12,552 | 13,084 | 13,329 | 13,111 |
| 2023 | 13,698 | 13,604 | 13,157 | 13,410 | 12,775 | 11,739 | 12,307 | 12,913 | 12,285 | 12,968 | 13,600 | 13,152 |
| 2024 | 13,279 | |||||||||||
| - = No Data Reported; -- = Not Applicable; NA = Not Available; W = Withheld to avoid disclosure of individual company data. |
| Release Date: 3/29/2024 |
| Next Release Date: 4/30/2024 |