|
Download Data (XLS File) |
|
||||||||
|
||||||||
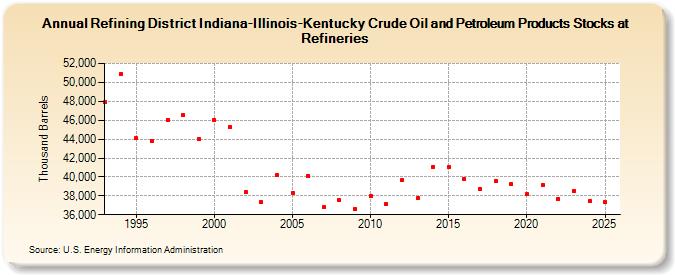
| Refining District Indiana-Illinois-Kentucky Crude Oil and Petroleum Products Stocks at Refineries (Thousand Barrels) | ||||||||
| Decade | Year-0 | Year-1 | Year-2 | Year-3 | Year-4 | Year-5 | Year-6 | Year-7 | Year-8 | Year-9 |
|---|---|---|---|---|---|---|---|---|---|---|
| 1990's | 47,893 | 50,874 | 44,081 | 43,827 | 46,036 | 46,549 | 44,005 | |||
| 2000's | 45,987 | 45,305 | 38,397 | 37,312 | 40,151 | 38,332 | 40,107 | 36,781 | 37,526 | 36,591 |
| 2010's | 38,002 | 37,107 | 39,674 | 37,726 | 41,100 | 41,079 | 39,768 | 38,706 | 39,576 | 39,237 |
| 2020's | 38,146 | 39,169 | 37,681 | 38,613 |
| - = No Data Reported; -- = Not Applicable; NA = Not Available; W = Withheld to avoid disclosure of individual company data. |
| Release Date: 4/30/2024 |
| Next Release Date: 8/30/2024 |