|
Download Data (XLS File) |
|
||||||||
|
||||||||
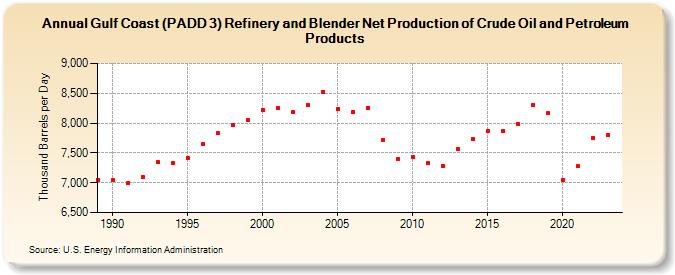
| Gulf Coast (PADD 3) Refinery and Blender Net Production of Crude Oil and Petroleum Products (Thousand Barrels per Day) | ||||||||
| Decade | Year-0 | Year-1 | Year-2 | Year-3 | Year-4 | Year-5 | Year-6 | Year-7 | Year-8 | Year-9 |
|---|---|---|---|---|---|---|---|---|---|---|
| 1980's | 7,053 | |||||||||
| 1990's | 7,045 | 6,998 | 7,099 | 7,347 | 7,332 | 7,416 | 7,658 | 7,828 | 7,972 | 8,056 |
| 2000's | 8,224 | 8,258 | 8,180 | 8,312 | 8,528 | 8,234 | 8,184 | 8,257 | 7,722 | 7,395 |
| 2010's | 7,435 | 7,327 | 7,284 | 7,569 | 7,730 | 7,870 | 7,873 | 7,986 | 8,312 | 8,165 |
| 2020's | 7,045 | 7,273 | 7,754 | 7,803 |
| - = No Data Reported; -- = Not Applicable; NA = Not Available; W = Withheld to avoid disclosure of individual company data. |
| Release Date: 3/29/2024 |
| Next Release Date: 8/30/2024 |