|
Download Data (XLS File) |
|
||||||||
|
||||||||
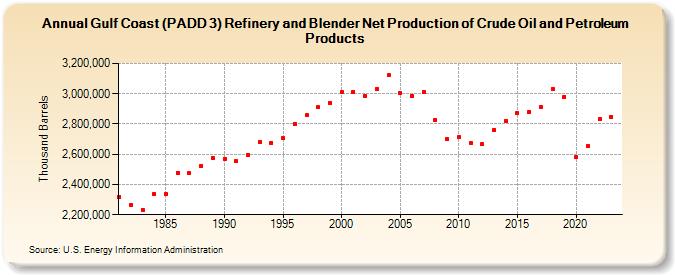
| Gulf Coast (PADD 3) Refinery and Blender Net Production of Crude Oil and Petroleum Products (Thousand Barrels) | ||||||||
| Decade | Year-0 | Year-1 | Year-2 | Year-3 | Year-4 | Year-5 | Year-6 | Year-7 | Year-8 | Year-9 |
|---|---|---|---|---|---|---|---|---|---|---|
| 1980's | 2,319,338 | 2,266,021 | 2,232,989 | 2,339,895 | 2,337,868 | 2,479,028 | 2,473,579 | 2,522,356 | 2,574,197 | |
| 1990's | 2,571,607 | 2,554,239 | 2,598,067 | 2,681,793 | 2,676,068 | 2,706,885 | 2,802,840 | 2,857,271 | 2,909,930 | 2,940,578 |
| 2000's | 3,010,166 | 3,014,226 | 2,985,763 | 3,033,777 | 3,121,165 | 3,005,474 | 2,987,041 | 3,013,929 | 2,826,359 | 2,699,330 |
| 2010's | 2,713,717 | 2,674,491 | 2,665,992 | 2,762,540 | 2,821,630 | 2,872,432 | 2,881,627 | 2,914,872 | 3,033,977 | 2,980,136 |
| 2020's | 2,578,563 | 2,654,719 | 2,830,183 | 2,847,986 |
| - = No Data Reported; -- = Not Applicable; NA = Not Available; W = Withheld to avoid disclosure of individual company data. |
| Release Date: 3/29/2024 |
| Next Release Date: 8/30/2024 |