|
Download Data (XLS File) |
|
||||||||
|
||||||||
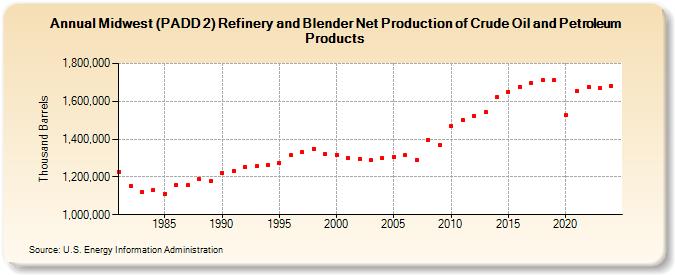
| Midwest (PADD 2) Refinery and Blender Net Production of Crude Oil and Petroleum Products (Thousand Barrels) | ||||||||
| Decade | Year-0 | Year-1 | Year-2 | Year-3 | Year-4 | Year-5 | Year-6 | Year-7 | Year-8 | Year-9 |
|---|---|---|---|---|---|---|---|---|---|---|
| 1980's | 1,227,644 | 1,152,253 | 1,121,827 | 1,130,187 | 1,111,614 | 1,158,339 | 1,154,792 | 1,188,320 | 1,177,548 | |
| 1990's | 1,221,303 | 1,232,407 | 1,253,556 | 1,256,679 | 1,263,196 | 1,274,788 | 1,314,462 | 1,331,351 | 1,349,032 | 1,320,691 |
| 2000's | 1,318,486 | 1,298,739 | 1,293,767 | 1,287,728 | 1,298,746 | 1,307,675 | 1,314,180 | 1,289,624 | 1,395,958 | 1,368,167 |
| 2010's | 1,468,512 | 1,502,253 | 1,523,608 | 1,542,379 | 1,622,141 | 1,649,608 | 1,678,018 | 1,698,090 | 1,712,299 | 1,712,576 |
| 2020's | 1,525,965 | 1,653,497 | 1,677,561 | 1,668,188 |
| - = No Data Reported; -- = Not Applicable; NA = Not Available; W = Withheld to avoid disclosure of individual company data. |
| Release Date: 3/29/2024 |
| Next Release Date: 8/30/2024 |