|
Download Data (XLS File) |
|
||||||||
|
||||||||
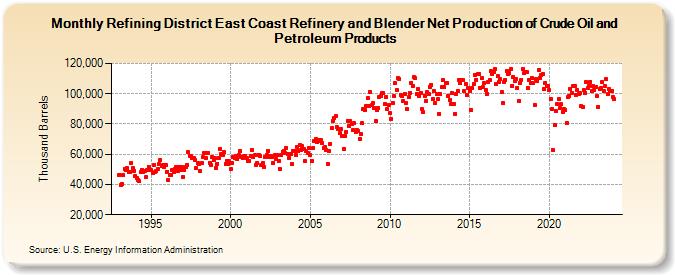
| Refining District East Coast Refinery and Blender Net Production of Crude Oil and Petroleum Products (Thousand Barrels) | ||||||||
| Year | Jan | Feb | Mar | Apr | May | Jun | Jul | Aug | Sep | Oct | Nov | Dec |
|---|---|---|---|---|---|---|---|---|---|---|---|---|
| 1993 | 46,457 | 39,402 | 40,527 | 46,091 | 50,540 | 49,532 | 50,688 | 47,926 | 48,435 | 54,455 | 50,772 | 49,171 |
| 1994 | 45,830 | 44,457 | 43,234 | 42,112 | 48,205 | 49,890 | 48,437 | 49,044 | 44,718 | 49,370 | 51,793 | 49,743 |
| 1995 | 49,589 | 47,406 | 52,968 | 48,088 | 48,652 | 50,544 | 53,470 | 56,145 | 52,319 | 53,058 | 51,626 | 52,666 |
| 1996 | 48,429 | 43,218 | 46,202 | 46,334 | 49,398 | 48,233 | 50,011 | 51,593 | 49,063 | 51,734 | 49,834 | 51,655 |
| 1997 | 44,998 | 49,284 | 51,789 | 52,963 | 61,194 | 59,068 | 58,798 | 57,815 | 57,315 | 56,078 | 50,939 | 54,326 |
| 1998 | 53,501 | 48,682 | 54,203 | 57,904 | 61,000 | 57,623 | 60,922 | 61,039 | 54,483 | 52,625 | 58,398 | 55,960 |
| 1999 | 57,373 | 50,942 | 53,813 | 57,743 | 63,526 | 60,338 | 59,238 | 61,241 | 53,624 | 55,561 | 53,260 | 55,266 |
| 2000 | 49,931 | 54,066 | 58,105 | 57,286 | 58,808 | 56,611 | 59,343 | 61,868 | 58,298 | 57,179 | 58,817 | 58,901 |
| 2001 | 57,405 | 55,566 | 55,724 | 58,938 | 62,875 | 58,134 | 59,479 | 52,667 | 54,351 | 59,733 | 58,929 | 52,788 |
| 2002 | 53,889 | 51,496 | 58,406 | 59,645 | 62,342 | 58,246 | 58,683 | 57,905 | 54,202 | 59,184 | 56,993 | 59,209 |
| 2003 | 55,584 | 50,353 | 59,769 | 61,692 | 62,201 | 60,690 | 64,181 | 60,271 | 57,803 | 60,033 | 53,448 | 62,437 |
| 2004 | 61,998 | 59,352 | 65,038 | 61,833 | 66,121 | 62,687 | 65,244 | 63,336 | 55,300 | 61,928 | 60,818 | 64,214 |
| 2005 | 59,348 | 55,742 | 63,884 | 68,595 | 69,793 | 68,212 | 69,506 | 68,617 | 69,288 | 67,690 | 64,012 | 64,631 |
| 2006 | 62,948 | 53,628 | 62,367 | 67,050 | 77,116 | 81,691 | 83,699 | 85,083 | 77,676 | 76,465 | 73,708 | 76,550 |
| 2007 | 71,788 | 63,739 | 72,129 | 74,928 | 82,145 | 78,663 | 81,873 | 80,123 | 75,901 | 80,429 | 74,899 | 76,225 |
| 2008 | 75,304 | 70,038 | 73,058 | 80,330 | 89,676 | 89,064 | 91,729 | 97,169 | 91,958 | 101,242 | 92,309 | 93,563 |
| 2009 | 90,639 | 82,123 | 89,313 | 90,806 | 98,099 | 98,561 | 100,532 | 100,439 | 93,115 | 97,947 | 89,789 | 92,842 |
| 2010 | 87,005 | 83,504 | 94,079 | 98,717 | 106,949 | 102,650 | 110,173 | 109,804 | 99,114 | 98,599 | 95,378 | 100,113 |
| 2011 | 93,794 | 89,853 | 97,634 | 100,485 | 107,205 | 105,358 | 110,986 | 110,202 | 99,986 | 103,067 | 98,537 | 100,488 |
| 2012 | 89,681 | 87,796 | 98,691 | 95,488 | 100,857 | 100,035 | 104,593 | 106,064 | 96,468 | 101,792 | 93,854 | 99,993 |
| 2013 | 96,253 | 86,896 | 99,903 | 104,323 | 108,852 | 104,574 | 106,815 | 106,884 | 98,597 | 96,019 | 92,981 | 100,390 |
| 2014 | 93,518 | 86,875 | 100,015 | 101,965 | 109,211 | 106,868 | 109,288 | 108,785 | 101,724 | 106,517 | 99,223 | 104,036 |
| 2015 | 101,654 | 89,254 | 103,929 | 106,264 | 112,535 | 109,288 | 112,941 | 113,332 | 104,112 | 110,321 | 104,352 | 106,806 |
| 2016 | 102,584 | 99,955 | 107,460 | 108,756 | 114,715 | 112,823 | 114,442 | 116,245 | 106,521 | 111,628 | 107,832 | 109,773 |
| 2017 | 100,872 | 93,750 | 107,696 | 108,913 | 115,234 | 112,848 | 113,719 | 116,057 | 105,414 | 111,277 | 108,361 | 109,550 |
| 2018 | 103,875 | 95,027 | 107,270 | 109,368 | 116,204 | 113,443 | 114,209 | 114,115 | 103,852 | 109,375 | 106,784 | 110,176 |
| 2019 | 106,920 | 92,569 | 109,499 | 108,708 | 115,675 | 110,707 | 112,123 | 113,335 | 103,070 | 107,002 | 104,844 | 105,011 |
| 2020 | 102,415 | 96,294 | 89,753 | 62,510 | 79,069 | 88,644 | 93,287 | 96,508 | 90,439 | 92,921 | 87,783 | 90,049 |
| 2021 | 89,220 | 80,638 | 97,779 | 98,417 | 103,354 | 100,754 | 104,995 | 105,118 | 99,489 | 102,244 | 99,670 | 100,328 |
| 2022 | 91,738 | 91,355 | 102,403 | 100,624 | 107,672 | 103,688 | 105,292 | 108,029 | 101,786 | 105,280 | 102,185 | 104,168 |
| 2023 | 98,275 | 91,537 | 103,153 | 103,526 | 107,578 | 101,655 | 105,218 | 109,460 | 99,815 | 103,116 | 101,594 | 101,727 |
| 2024 | 97,814 | |||||||||||
| - = No Data Reported; -- = Not Applicable; NA = Not Available; W = Withheld to avoid disclosure of individual company data. |
| Release Date: 3/29/2024 |
| Next Release Date: 4/30/2024 |