|
Download Data (XLS File) |
|
||||||||
|
||||||||
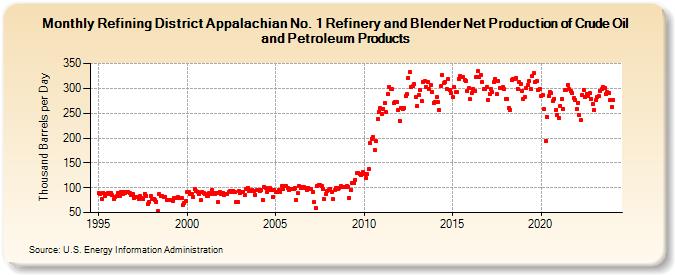
| Refining District Appalachian No. 1 Refinery and Blender Net Production of Crude Oil and Petroleum Products (Thousand Barrels per Day) | ||||||||
| Year | Jan | Feb | Mar | Apr | May | Jun | Jul | Aug | Sep | Oct | Nov | Dec |
|---|---|---|---|---|---|---|---|---|---|---|---|---|
| 1995 | 89 | 88 | 77 | 90 | 83 | 88 | 89 | 87 | 90 | 85 | 77 | 81 |
| 1996 | 83 | 89 | 84 | 91 | 87 | 91 | 90 | 91 | 91 | 89 | 85 | 88 |
| 1997 | 80 | 82 | 81 | 78 | 84 | 80 | 77 | 88 | 84 | 67 | 72 | 83 |
| 1998 | 78 | 77 | 76 | 72 | 53 | 87 | 84 | 83 | 82 | 82 | 76 | 75 |
| 1999 | 76 | 75 | 73 | 79 | 80 | 80 | 81 | 79 | 80 | 66 | 70 | 74 |
| 2000 | 91 | 92 | 87 | 88 | 81 | 98 | 94 | 92 | 88 | 75 | 92 | 89 |
| 2001 | 88 | 84 | 84 | 89 | 88 | 96 | 89 | 88 | 89 | 71 | 92 | 87 |
| 2002 | 90 | 85 | 87 | 87 | 91 | 93 | 91 | 94 | 92 | 71 | 71 | 93 |
| 2003 | 90 | 91 | 91 | 86 | 98 | 100 | 93 | 93 | 96 | 93 | 86 | 95 |
| 2004 | 96 | 94 | 96 | 75 | 102 | 100 | 91 | 95 | 99 | 95 | 82 | 95 |
| 2005 | 91 | 92 | 96 | 92 | 103 | 98 | 103 | 103 | 99 | 95 | 98 | 98 |
| 2006 | 98 | 100 | 76 | 89 | 103 | 99 | 101 | 102 | 99 | 96 | 100 | 97 |
| 2007 | 97 | 92 | 71 | 59 | 104 | 106 | 105 | 103 | 97 | 77 | 87 | 93 |
| 2008 | 96 | 98 | 91 | 77 | 95 | 99 | 98 | 100 | 103 | 101 | 101 | 102 |
| 2009 | 104 | 102 | 80 | 96 | 109 | 109 | 116 | 129 | 130 | 127 | 125 | 131 |
| 2010 | 127 | 119 | 128 | 137 | 189 | 199 | 202 | 176 | 194 | 238 | 253 | 260 |
| 2011 | 249 | 259 | 271 | 252 | 289 | 303 | 298 | 298 | 270 | 272 | 272 | 257 |
| 2012 | 235 | 261 | 259 | 260 | 284 | 288 | 321 | 333 | 303 | 305 | 309 | 283 |
| 2013 | 264 | 286 | 296 | 274 | 313 | 314 | 303 | 312 | 298 | 307 | 292 | 271 |
| 2014 | 272 | 282 | 272 | 256 | 304 | 326 | 310 | 312 | 298 | 318 | 296 | 290 |
| 2015 | 282 | 303 | 292 | 292 | 319 | 324 | 322 | 322 | 317 | 315 | 295 | 300 |
| 2016 | 278 | 291 | 299 | 295 | 323 | 334 | 323 | 327 | 313 | 299 | 299 | 303 |
| 2017 | 277 | 289 | 298 | 292 | 312 | 319 | 288 | 314 | 301 | 301 | 302 | 298 |
| 2018 | 279 | 279 | 261 | 257 | 317 | 319 | 319 | 321 | 299 | 313 | 308 | 295 |
| 2019 | 279 | 283 | 300 | 306 | 315 | 299 | 325 | 331 | 312 | 314 | 296 | 299 |
| 2020 | 285 | 287 | 259 | 194 | 243 | 284 | 292 | 290 | 275 | 279 | 257 | 247 |
| 2021 | 241 | 265 | 279 | 259 | 296 | 297 | 307 | 298 | 294 | 290 | 280 | 277 |
| 2022 | 258 | 271 | 246 | 236 | 287 | 297 | 282 | 289 | 284 | 290 | 279 | 268 |
| 2023 | 257 | 276 | 283 | 284 | 295 | 298 | 303 | 301 | 288 | 292 | 290 | 276 |
| 2024 | 263 | |||||||||||
| - = No Data Reported; -- = Not Applicable; NA = Not Available; W = Withheld to avoid disclosure of individual company data. |
| Release Date: 3/29/2024 |
| Next Release Date: 4/30/2024 |