|
Download Data (XLS File) |
|
||||||||
|
||||||||
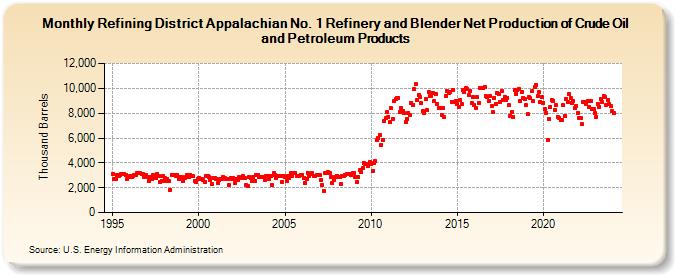
| Refining District Appalachian No. 1 Refinery and Blender Net Production of Crude Oil and Petroleum Products (Thousand Barrels) | ||||||||
| Year | Jan | Feb | Mar | Apr | May | Jun | Jul | Aug | Sep | Oct | Nov | Dec |
|---|---|---|---|---|---|---|---|---|---|---|---|---|
| 1995 | 3,129 | 2,718 | 2,686 | 3,013 | 2,930 | 3,048 | 3,139 | 3,123 | 3,140 | 3,046 | 2,699 | 2,868 |
| 1996 | 2,962 | 2,902 | 2,966 | 3,003 | 3,020 | 3,156 | 3,184 | 3,181 | 3,087 | 3,084 | 2,894 | 3,059 |
| 1997 | 2,826 | 2,556 | 2,854 | 2,689 | 3,021 | 2,831 | 2,805 | 3,132 | 2,909 | 2,458 | 2,534 | 2,950 |
| 1998 | 2,794 | 2,525 | 2,713 | 2,526 | 1,833 | 3,054 | 3,058 | 3,004 | 2,936 | 3,018 | 2,682 | 2,831 |
| 1999 | 2,839 | 2,543 | 2,755 | 2,855 | 3,009 | 2,886 | 3,046 | 2,969 | 2,905 | 2,531 | 2,479 | 2,718 |
| 2000 | 2,816 | 2,665 | 2,694 | 2,627 | 2,496 | 2,931 | 2,928 | 2,854 | 2,633 | 2,318 | 2,747 | 2,753 |
| 2001 | 2,720 | 2,355 | 2,593 | 2,681 | 2,724 | 2,879 | 2,762 | 2,736 | 2,662 | 2,214 | 2,747 | 2,701 |
| 2002 | 2,788 | 2,382 | 2,684 | 2,605 | 2,832 | 2,799 | 2,814 | 2,921 | 2,750 | 2,215 | 2,130 | 2,894 |
| 2003 | 2,791 | 2,558 | 2,829 | 2,580 | 3,045 | 3,002 | 2,887 | 2,878 | 2,892 | 2,894 | 2,583 | 2,934 |
| 2004 | 2,979 | 2,719 | 2,969 | 2,252 | 3,169 | 3,003 | 2,813 | 2,935 | 2,968 | 2,946 | 2,453 | 2,943 |
| 2005 | 2,830 | 2,565 | 2,973 | 2,752 | 3,208 | 2,933 | 3,183 | 3,202 | 2,978 | 2,940 | 2,954 | 3,025 |
| 2006 | 3,045 | 2,805 | 2,357 | 2,671 | 3,203 | 2,974 | 3,130 | 3,170 | 2,974 | 2,976 | 3,014 | 3,009 |
| 2007 | 3,016 | 2,585 | 2,216 | 1,760 | 3,209 | 3,176 | 3,266 | 3,184 | 2,896 | 2,378 | 2,609 | 2,884 |
| 2008 | 2,975 | 2,835 | 2,833 | 2,308 | 2,935 | 2,977 | 3,040 | 3,112 | 3,081 | 3,141 | 3,036 | 3,158 |
| 2009 | 3,216 | 2,855 | 2,479 | 2,894 | 3,391 | 3,255 | 3,604 | 4,014 | 3,900 | 3,946 | 3,760 | 4,064 |
| 2010 | 3,938 | 3,340 | 3,971 | 4,114 | 5,845 | 5,977 | 6,248 | 5,460 | 5,828 | 7,376 | 7,580 | 8,067 |
| 2011 | 7,715 | 7,251 | 8,401 | 7,550 | 8,944 | 9,104 | 9,237 | 9,227 | 8,090 | 8,423 | 8,145 | 7,974 |
| 2012 | 7,292 | 7,563 | 8,020 | 7,813 | 8,794 | 8,641 | 9,939 | 10,317 | 9,093 | 9,456 | 9,274 | 8,787 |
| 2013 | 8,183 | 8,012 | 9,166 | 8,230 | 9,712 | 9,417 | 9,384 | 9,660 | 8,943 | 9,518 | 8,760 | 8,393 |
| 2014 | 8,447 | 7,887 | 8,420 | 7,674 | 9,414 | 9,776 | 9,624 | 9,680 | 8,926 | 9,866 | 8,877 | 8,975 |
| 2015 | 8,743 | 8,487 | 9,039 | 8,750 | 9,883 | 9,731 | 9,988 | 9,971 | 9,500 | 9,775 | 8,837 | 9,309 |
| 2016 | 8,618 | 8,435 | 9,262 | 8,849 | 10,000 | 10,023 | 10,015 | 10,135 | 9,392 | 9,265 | 8,970 | 9,399 |
| 2017 | 8,597 | 8,079 | 9,251 | 8,768 | 9,657 | 9,570 | 8,934 | 9,749 | 9,040 | 9,336 | 9,060 | 9,249 |
| 2018 | 8,639 | 7,805 | 8,086 | 7,695 | 9,837 | 9,568 | 9,897 | 9,963 | 8,966 | 9,694 | 9,243 | 9,134 |
| 2019 | 8,649 | 7,932 | 9,292 | 9,194 | 9,764 | 8,974 | 10,072 | 10,274 | 9,372 | 9,730 | 8,883 | 9,284 |
| 2020 | 8,848 | 8,325 | 8,038 | 5,829 | 7,521 | 8,514 | 9,057 | 8,983 | 8,256 | 8,655 | 7,709 | 7,647 |
| 2021 | 7,464 | 7,415 | 8,635 | 7,776 | 9,167 | 8,914 | 9,505 | 9,236 | 8,830 | 8,991 | 8,389 | 8,581 |
| 2022 | 7,995 | 7,586 | 7,622 | 7,089 | 8,882 | 8,906 | 8,740 | 8,949 | 8,512 | 8,996 | 8,366 | 8,318 |
| 2023 | 7,980 | 7,717 | 8,770 | 8,525 | 9,138 | 8,930 | 9,397 | 9,324 | 8,648 | 9,063 | 8,710 | 8,551 |
| 2024 | 8,165 | |||||||||||
| - = No Data Reported; -- = Not Applicable; NA = Not Available; W = Withheld to avoid disclosure of individual company data. |
| Release Date: 3/29/2024 |
| Next Release Date: 4/30/2024 |