|
Download Data (XLS File) |
|
||||||||
|
||||||||
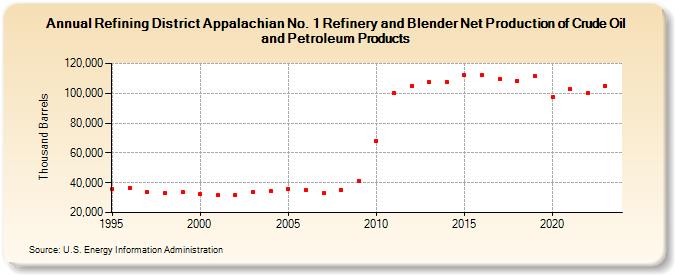
| Refining District Appalachian No. 1 Refinery and Blender Net Production of Crude Oil and Petroleum Products (Thousand Barrels) | ||||||||
| Decade | Year-0 | Year-1 | Year-2 | Year-3 | Year-4 | Year-5 | Year-6 | Year-7 | Year-8 | Year-9 |
|---|---|---|---|---|---|---|---|---|---|---|
| 1990's | 35,539 | 36,498 | 33,565 | 32,974 | 33,535 | |||||
| 2000's | 32,462 | 31,774 | 31,814 | 33,873 | 34,149 | 35,543 | 35,328 | 33,179 | 35,431 | 41,378 |
| 2010's | 67,744 | 100,061 | 104,989 | 107,378 | 107,566 | 112,013 | 112,363 | 109,290 | 108,527 | 111,420 |
| 2020's | 97,382 | 102,903 | 99,961 | 105,214 |
| - = No Data Reported; -- = Not Applicable; NA = Not Available; W = Withheld to avoid disclosure of individual company data. |
| Release Date: 8/30/2024 |
| Next Release Date: 8/29/2025 |