|
Download Data (XLS File) |
|
||||||||
|
||||||||
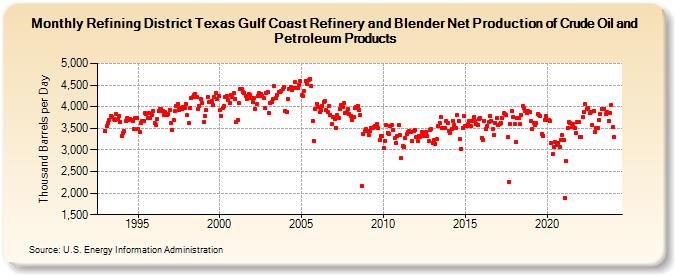
| Refining District Texas Gulf Coast Refinery and Blender Net Production of Crude Oil and Petroleum Products (Thousand Barrels per Day) | ||||||||
| Year | Jan | Feb | Mar | Apr | May | Jun | Jul | Aug | Sep | Oct | Nov | Dec |
|---|---|---|---|---|---|---|---|---|---|---|---|---|
| 1993 | 3,431 | 3,551 | 3,627 | 3,689 | 3,796 | 3,752 | 3,719 | 3,701 | 3,832 | 3,708 | 3,795 | 3,653 |
| 1994 | 3,330 | 3,385 | 3,442 | 3,675 | 3,746 | 3,701 | 3,717 | 3,689 | 3,661 | 3,473 | 3,744 | 3,731 |
| 1995 | 3,482 | 3,414 | 3,633 | 3,671 | 3,665 | 3,852 | 3,839 | 3,748 | 3,848 | 3,747 | 3,811 | 3,902 |
| 1996 | 3,614 | 3,571 | 3,723 | 3,894 | 3,936 | 3,941 | 3,906 | 3,810 | 3,866 | 3,808 | 3,842 | 3,931 |
| 1997 | 3,628 | 3,459 | 3,701 | 3,899 | 4,021 | 4,061 | 3,925 | 3,972 | 3,938 | 4,000 | 3,979 | 4,067 |
| 1998 | 3,797 | 3,627 | 3,976 | 4,191 | 4,221 | 4,272 | 4,304 | 4,217 | 3,947 | 4,007 | 4,169 | 4,086 |
| 1999 | 3,639 | 3,775 | 3,923 | 4,227 | 4,101 | 4,116 | 4,131 | 4,035 | 4,235 | 4,319 | 4,179 | 4,258 |
| 2000 | 3,912 | 3,783 | 3,968 | 4,005 | 4,224 | 4,245 | 4,146 | 4,080 | 4,278 | 4,225 | 4,308 | 4,187 |
| 2001 | 3,654 | 3,693 | 4,083 | 4,407 | 4,398 | 4,347 | 4,318 | 4,239 | 4,180 | 4,304 | 4,281 | 4,207 |
| 2002 | 4,110 | 4,190 | 3,946 | 4,058 | 4,250 | 4,306 | 4,295 | 4,256 | 4,199 | 3,960 | 4,321 | 4,350 |
| 2003 | 3,862 | 4,089 | 4,113 | 4,180 | 4,472 | 4,197 | 4,279 | 4,341 | 4,341 | 4,359 | 4,402 | 4,447 |
| 2004 | 3,907 | 3,868 | 4,169 | 4,405 | 4,457 | 4,382 | 4,440 | 4,562 | 4,430 | 4,433 | 4,500 | 4,584 |
| 2005 | 4,265 | 4,254 | 4,365 | 4,604 | 4,536 | 4,620 | 4,647 | 4,477 | 3,660 | 3,211 | 3,945 | 4,073 |
| 2006 | 3,986 | 3,870 | 3,914 | 4,016 | 4,110 | 4,139 | 3,924 | 3,878 | 4,013 | 3,818 | 3,607 | 3,754 |
| 2007 | 3,726 | 3,514 | 3,802 | 3,741 | 3,950 | 4,031 | 4,004 | 4,089 | 3,852 | 3,877 | 3,941 | 3,842 |
| 2008 | 3,786 | 3,691 | 3,752 | 3,961 | 4,002 | 4,016 | 3,934 | 3,804 | 2,168 | 3,372 | 3,447 | 3,473 |
| 2009 | 3,431 | 3,351 | 3,426 | 3,498 | 3,518 | 3,521 | 3,564 | 3,602 | 3,499 | 3,221 | 3,323 | 3,323 |
| 2010 | 3,045 | 3,197 | 3,572 | 3,396 | 3,374 | 3,554 | 3,571 | 3,457 | 3,264 | 3,169 | 3,311 | 3,578 |
| 2011 | 3,335 | 2,811 | 3,087 | 3,071 | 3,281 | 3,372 | 3,407 | 3,448 | 3,408 | 3,215 | 3,436 | 3,452 |
| 2012 | 3,288 | 3,198 | 3,324 | 3,309 | 3,422 | 3,362 | 3,322 | 3,422 | 3,316 | 3,209 | 3,467 | 3,487 |
| 2013 | 3,166 | 3,235 | 3,145 | 3,248 | 3,553 | 3,633 | 3,763 | 3,503 | 3,500 | 3,512 | 3,676 | 3,627 |
| 2014 | 3,440 | 3,397 | 3,485 | 3,668 | 3,578 | 3,510 | 3,804 | 3,661 | 3,243 | 3,024 | 3,517 | 3,796 |
| 2015 | 3,548 | 3,561 | 3,593 | 3,659 | 3,563 | 3,671 | 3,756 | 3,665 | 3,598 | 3,579 | 3,709 | 3,741 |
| 2016 | 3,273 | 3,232 | 3,673 | 3,485 | 3,545 | 3,639 | 3,792 | 3,659 | 3,479 | 3,349 | 3,631 | 3,745 |
| 2017 | 3,569 | 3,591 | 3,627 | 3,728 | 3,843 | 3,823 | 3,804 | 3,287 | 2,262 | 3,590 | 3,889 | 3,765 |
| 2018 | 3,598 | 3,194 | 3,733 | 3,742 | 3,592 | 3,805 | 4,015 | 3,974 | 3,903 | 3,856 | 3,890 | 3,876 |
| 2019 | 3,670 | 3,488 | 3,633 | 3,578 | 3,616 | 3,821 | 3,810 | 3,774 | 3,375 | 3,330 | 3,684 | 3,794 |
| 2020 | 3,690 | 3,694 | 3,664 | 3,159 | 2,902 | 3,078 | 3,173 | 3,113 | 3,151 | 3,073 | 3,240 | 3,338 |
| 2021 | 3,230 | 1,895 | 2,740 | 3,506 | 3,648 | 3,624 | 3,524 | 3,600 | 3,515 | 3,388 | 3,644 | 3,657 |
| 2022 | 3,298 | 3,296 | 3,757 | 3,872 | 4,054 | 3,953 | 3,969 | 3,851 | 3,884 | 3,568 | 3,911 | 3,413 |
| 2023 | 3,497 | 3,501 | 3,683 | 3,820 | 3,953 | 3,952 | 3,958 | 3,822 | 3,871 | 3,667 | 3,859 | 4,050 |
| 2024 | 3,525 | |||||||||||
| - = No Data Reported; -- = Not Applicable; NA = Not Available; W = Withheld to avoid disclosure of individual company data. |
| Release Date: 3/29/2024 |
| Next Release Date: 4/30/2024 |