|
Download Data (XLS File) |
|
||||||||
|
||||||||
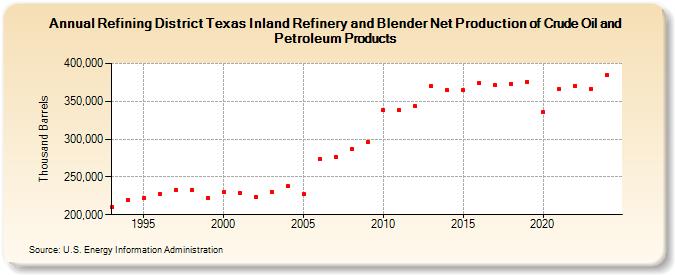
| Refining District Texas Inland Refinery and Blender Net Production of Crude Oil and Petroleum Products (Thousand Barrels) | ||||||||
| Decade | Year-0 | Year-1 | Year-2 | Year-3 | Year-4 | Year-5 | Year-6 | Year-7 | Year-8 | Year-9 |
|---|---|---|---|---|---|---|---|---|---|---|
| 1990's | 209,596 | 219,491 | 222,494 | 227,481 | 233,074 | 232,974 | 222,584 | |||
| 2000's | 229,896 | 229,223 | 223,207 | 230,544 | 237,694 | 227,283 | 273,057 | 276,970 | 286,898 | 295,622 |
| 2010's | 338,259 | 338,249 | 343,398 | 370,046 | 364,884 | 364,473 | 373,881 | 371,041 | 373,512 | 376,108 |
| 2020's | 335,562 | 366,487 | 370,680 | 366,356 |
| - = No Data Reported; -- = Not Applicable; NA = Not Available; W = Withheld to avoid disclosure of individual company data. |
| Release Date: 3/29/2024 |
| Next Release Date: 8/30/2024 |