|
Download Data (XLS File) |
|
||||||||
|
||||||||
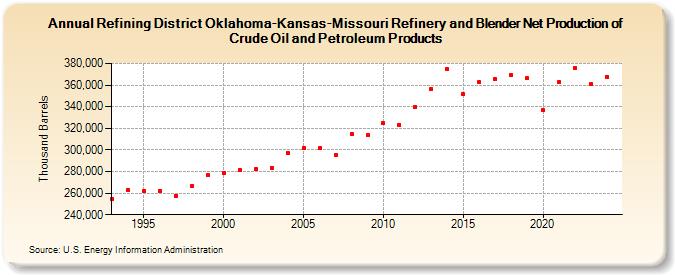
| Refining District Oklahoma-Kansas-Missouri Refinery and Blender Net Production of Crude Oil and Petroleum Products (Thousand Barrels) | ||||||||
| Decade | Year-0 | Year-1 | Year-2 | Year-3 | Year-4 | Year-5 | Year-6 | Year-7 | Year-8 | Year-9 |
|---|---|---|---|---|---|---|---|---|---|---|
| 1990's | 254,616 | 262,660 | 262,041 | 261,985 | 257,614 | 266,616 | 276,385 | |||
| 2000's | 278,789 | 281,426 | 282,375 | 283,404 | 297,242 | 301,841 | 301,381 | 295,047 | 314,827 | 313,773 |
| 2010's | 324,492 | 323,229 | 339,788 | 356,301 | 374,520 | 351,433 | 362,711 | 365,593 | 369,279 | 366,288 |
| 2020's | 336,824 | 362,858 | 375,787 | 360,551 |
| - = No Data Reported; -- = Not Applicable; NA = Not Available; W = Withheld to avoid disclosure of individual company data. |
| Release Date: 3/29/2024 |
| Next Release Date: 8/30/2024 |