|
Download Data (XLS File) |
|
||||||||
|
||||||||
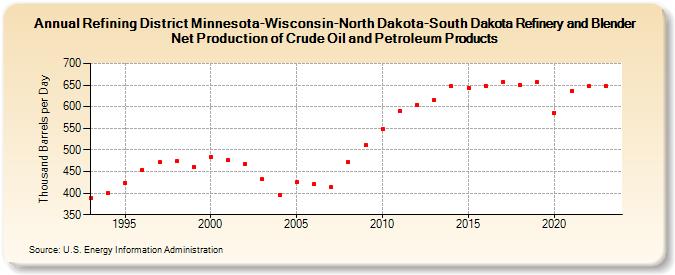
| Refining District Minnesota-Wisconsin-North Dakota-South Dakota Refinery and Blender Net Production of Crude Oil and Petroleum Products (Thousand Barrels per Day) | ||||||||
| Decade | Year-0 | Year-1 | Year-2 | Year-3 | Year-4 | Year-5 | Year-6 | Year-7 | Year-8 | Year-9 |
|---|---|---|---|---|---|---|---|---|---|---|
| 1990's | 389 | 400 | 424 | 454 | 471 | 474 | 461 | |||
| 2000's | 484 | 476 | 468 | 432 | 396 | 425 | 421 | 413 | 471 | 511 |
| 2010's | 548 | 590 | 605 | 616 | 647 | 644 | 649 | 658 | 650 | 657 |
| 2020's | 586 | 637 | 647 | 648 |
| - = No Data Reported; -- = Not Applicable; NA = Not Available; W = Withheld to avoid disclosure of individual company data. |
| Release Date: 3/29/2024 |
| Next Release Date: 8/30/2024 |