|
Download Data (XLS File) |
|
||||||||
|
||||||||
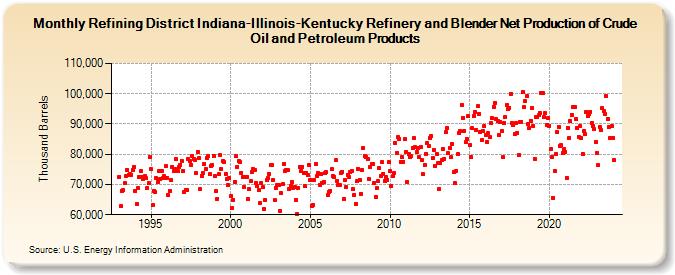
| Refining District Indiana-Illinois-Kentucky Refinery and Blender Net Production of Crude Oil and Petroleum Products (Thousand Barrels) | ||||||||
| Year | Jan | Feb | Mar | Apr | May | Jun | Jul | Aug | Sep | Oct | Nov | Dec |
|---|---|---|---|---|---|---|---|---|---|---|---|---|
| 1993 | 72,543 | 62,716 | 67,949 | 68,165 | 70,431 | 72,824 | 74,888 | 73,253 | 73,542 | 73,229 | 74,816 | 75,787 |
| 1994 | 67,999 | 63,530 | 68,723 | 72,366 | 74,367 | 72,598 | 71,811 | 72,645 | 72,043 | 68,968 | 70,415 | 78,954 |
| 1995 | 75,044 | 63,076 | 68,002 | 67,547 | 72,029 | 70,946 | 74,303 | 71,691 | 74,475 | 72,096 | 72,757 | 76,010 |
| 1996 | 72,286 | 66,449 | 67,869 | 71,632 | 75,859 | 74,400 | 75,254 | 78,285 | 74,331 | 75,616 | 76,524 | 77,857 |
| 1997 | 74,466 | 67,471 | 68,311 | 68,194 | 78,492 | 77,721 | 76,591 | 79,278 | 78,555 | 78,174 | 73,655 | 80,884 |
| 1998 | 78,749 | 68,515 | 72,919 | 73,839 | 76,928 | 75,127 | 78,640 | 79,303 | 73,352 | 76,212 | 76,505 | 79,410 |
| 1999 | 72,701 | 67,681 | 65,321 | 73,366 | 79,732 | 75,041 | 77,718 | 77,283 | 73,533 | 71,916 | 69,783 | 72,071 |
| 2000 | 66,226 | 62,370 | 65,019 | 70,737 | 79,309 | 75,785 | 77,812 | 77,386 | 73,887 | 72,434 | 69,023 | 72,436 |
| 2001 | 72,621 | 65,138 | 68,414 | 71,072 | 74,091 | 75,010 | 74,838 | 70,591 | 69,534 | 68,045 | 63,718 | 70,385 |
| 2002 | 69,055 | 61,780 | 65,010 | 71,413 | 72,090 | 73,511 | 76,350 | 76,530 | 71,515 | 64,746 | 68,765 | 69,869 |
| 2003 | 69,806 | 61,376 | 67,076 | 70,009 | 76,633 | 74,522 | 74,873 | 74,773 | 68,362 | 69,571 | 70,887 | 68,870 |
| 2004 | 69,212 | 64,822 | 60,291 | 68,773 | 75,876 | 74,570 | 75,928 | 73,921 | 69,484 | 73,861 | 73,151 | 76,508 |
| 2005 | 71,582 | 62,723 | 63,344 | 71,416 | 76,631 | 72,946 | 73,719 | 69,860 | 73,494 | 70,545 | 70,877 | 73,703 |
| 2006 | 73,986 | 66,509 | 67,633 | 67,772 | 75,027 | 72,961 | 72,517 | 77,998 | 71,097 | 69,969 | 69,811 | 73,931 |
| 2007 | 74,287 | 65,189 | 71,498 | 69,149 | 73,233 | 72,387 | 74,073 | 74,390 | 68,462 | 66,620 | 63,554 | 71,008 |
| 2008 | 75,214 | 71,509 | 66,978 | 74,886 | 82,159 | 79,414 | 79,122 | 78,438 | 71,725 | 75,749 | 76,701 | 76,735 |
| 2009 | 70,649 | 65,970 | 68,685 | 71,036 | 75,316 | 72,739 | 77,309 | 73,611 | 71,223 | 72,522 | 71,613 | 77,351 |
| 2010 | 74,387 | 69,443 | 72,701 | 73,788 | 83,738 | 80,281 | 85,537 | 85,085 | 77,522 | 79,033 | 77,577 | 85,020 |
| 2011 | 80,886 | 70,874 | 80,146 | 78,954 | 79,374 | 81,988 | 85,284 | 82,279 | 80,798 | 81,919 | 78,947 | 82,330 |
| 2012 | 77,994 | 73,371 | 76,485 | 80,169 | 83,679 | 82,723 | 85,354 | 86,045 | 78,880 | 81,531 | 76,132 | 79,965 |
| 2013 | 77,006 | 68,639 | 76,979 | 78,029 | 81,605 | 78,575 | 87,186 | 88,554 | 80,269 | 82,039 | 78,992 | 83,389 |
| 2014 | 74,066 | 70,385 | 74,485 | 80,040 | 87,112 | 87,529 | 96,372 | 92,134 | 87,773 | 83,887 | 85,130 | 92,631 |
| 2015 | 82,897 | 78,953 | 88,562 | 92,539 | 94,058 | 88,014 | 95,845 | 93,405 | 87,236 | 84,561 | 87,807 | 89,182 |
| 2016 | 86,453 | 84,084 | 86,883 | 85,692 | 90,247 | 91,914 | 95,739 | 97,039 | 91,643 | 90,943 | 86,379 | 90,669 |
| 2017 | 87,632 | 78,983 | 90,305 | 92,171 | 96,192 | 94,863 | 95,366 | 100,006 | 90,404 | 89,666 | 86,574 | 90,205 |
| 2018 | 87,085 | 79,709 | 90,614 | 90,780 | 100,506 | 95,534 | 97,460 | 99,156 | 89,905 | 88,645 | 91,131 | 95,189 |
| 2019 | 89,350 | 78,507 | 92,153 | 92,360 | 92,858 | 93,627 | 100,342 | 100,095 | 92,336 | 93,518 | 89,555 | 91,935 |
| 2020 | 89,455 | 81,692 | 79,083 | 65,658 | 74,562 | 80,028 | 87,294 | 89,140 | 82,719 | 82,889 | 80,457 | 81,629 |
| 2021 | 80,898 | 72,292 | 88,797 | 85,427 | 91,012 | 93,040 | 95,561 | 95,634 | 91,667 | 88,669 | 85,792 | 89,192 |
| 2022 | 85,426 | 80,196 | 87,734 | 86,557 | 93,899 | 92,626 | 93,207 | 94,048 | 90,436 | 89,341 | 88,182 | 84,144 |
| 2023 | 80,479 | 76,278 | 89,027 | 87,917 | 95,179 | 94,290 | 93,432 | 99,167 | 91,810 | 88,977 | 85,260 | 89,317 |
| 2024 | 85,467 | |||||||||||
| - = No Data Reported; -- = Not Applicable; NA = Not Available; W = Withheld to avoid disclosure of individual company data. |
| Release Date: 3/29/2024 |
| Next Release Date: 4/30/2024 |