|
Download Data (XLS File) |
|
||||||||
|
||||||||
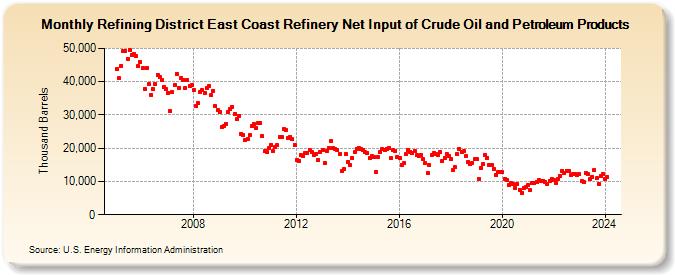
| Refining District East Coast Refinery Net Input of Crude Oil and Petroleum Products (Thousand Barrels) | ||||||||
| Year | Jan | Feb | Mar | Apr | May | Jun | Jul | Aug | Sep | Oct | Nov | Dec |
|---|---|---|---|---|---|---|---|---|---|---|---|---|
| 2005 | 43,783 | 40,978 | 44,776 | 49,236 | 49,238 | 46,896 | 49,533 | 48,128 | 48,366 | 47,706 | 44,587 | 45,861 |
| 2006 | 44,011 | 37,823 | 44,140 | 39,184 | 36,003 | 37,755 | 39,266 | 42,093 | 41,288 | 40,378 | 38,262 | 37,650 |
| 2007 | 36,599 | 31,141 | 36,744 | 39,020 | 42,416 | 38,156 | 41,168 | 40,576 | 38,142 | 40,532 | 38,694 | 38,922 |
| 2008 | 37,555 | 32,634 | 33,506 | 36,785 | 37,441 | 36,519 | 38,172 | 38,711 | 35,850 | 37,191 | 32,584 | 31,388 |
| 2009 | 30,738 | 26,452 | 26,713 | 27,397 | 31,008 | 31,774 | 32,385 | 30,290 | 28,629 | 29,750 | 24,409 | 23,908 |
| 2010 | 22,423 | 22,704 | 23,913 | 26,562 | 27,212 | 26,155 | 27,639 | 27,558 | 23,642 | 19,056 | 18,717 | 19,917 |
| 2011 | 21,073 | 19,004 | 20,363 | 20,809 | 23,438 | 23,418 | 25,800 | 25,517 | 23,048 | 23,468 | 22,648 | 20,855 |
| 2012 | 16,593 | 16,234 | 17,903 | 17,694 | 18,511 | 18,674 | 19,425 | 18,919 | 18,044 | 18,374 | 16,441 | 18,948 |
| 2013 | 19,517 | 15,570 | 19,296 | 20,029 | 22,111 | 19,973 | 19,821 | 19,385 | 18,277 | 13,024 | 13,730 | 18,183 |
| 2014 | 15,989 | 14,799 | 17,108 | 18,875 | 19,825 | 20,116 | 19,860 | 19,559 | 18,722 | 18,484 | 17,116 | 17,689 |
| 2015 | 17,228 | 12,857 | 17,399 | 18,801 | 19,717 | 19,447 | 19,811 | 20,115 | 17,024 | 19,313 | 19,160 | 17,357 |
| 2016 | 16,924 | 15,058 | 15,449 | 18,112 | 19,390 | 18,854 | 18,621 | 19,043 | 17,838 | 17,632 | 17,954 | 16,654 |
| 2017 | 15,417 | 12,506 | 14,800 | 17,986 | 18,565 | 18,276 | 18,027 | 18,885 | 16,226 | 17,136 | 18,103 | 17,614 |
| 2018 | 16,796 | 13,452 | 14,214 | 18,140 | 19,738 | 18,788 | 19,035 | 17,615 | 15,869 | 15,191 | 15,590 | 16,609 |
| 2019 | 16,692 | 10,814 | 14,042 | 15,275 | 17,865 | 17,098 | 14,904 | 14,804 | 13,841 | 11,885 | 12,728 | 12,958 |
| 2020 | 12,704 | 10,736 | 10,365 | 8,794 | 9,583 | 9,084 | 8,150 | 9,131 | 7,477 | 6,584 | 7,969 | 8,365 |
| 2021 | 8,991 | 7,401 | 9,527 | 9,473 | 9,880 | 10,452 | 10,184 | 10,226 | 9,772 | 9,191 | 10,148 | 10,770 |
| 2022 | 10,302 | 9,418 | 10,649 | 11,655 | 13,244 | 12,495 | 13,235 | 13,284 | 11,813 | 12,183 | 12,278 | 12,042 |
| 2023 | 12,097 | 10,085 | 9,700 | 12,537 | 12,103 | 10,747 | 11,357 | 13,337 | 10,943 | 9,345 | 11,614 | 12,386 |
| 2024 | 10,743 | 11,430 | ||||||||||
| - = No Data Reported; -- = Not Applicable; NA = Not Available; W = Withheld to avoid disclosure of individual company data. |
| Release Date: 4/30/2024 |
| Next Release Date: 5/31/2024 |