|
Download Data (XLS File) |
|
||||||||
|
||||||||
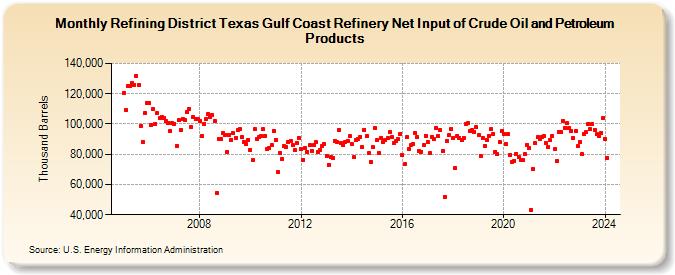
| Refining District Texas Gulf Coast Refinery Net Input of Crude Oil and Petroleum Products (Thousand Barrels) | ||||||||
| Year | Jan | Feb | Mar | Apr | May | Jun | Jul | Aug | Sep | Oct | Nov | Dec |
|---|---|---|---|---|---|---|---|---|---|---|---|---|
| 2005 | 120,655 | 109,302 | 124,782 | 124,925 | 126,955 | 125,943 | 131,958 | 125,988 | 98,360 | 88,110 | 107,348 | 113,966 |
| 2006 | 113,994 | 99,296 | 109,916 | 100,259 | 107,171 | 104,008 | 104,470 | 103,968 | 101,781 | 100,599 | 95,222 | 100,497 |
| 2007 | 100,275 | 85,646 | 102,301 | 96,169 | 103,488 | 102,582 | 107,738 | 110,105 | 98,109 | 104,737 | 103,017 | 103,420 |
| 2008 | 102,047 | 92,269 | 100,132 | 103,278 | 106,559 | 104,513 | 105,903 | 101,987 | 54,424 | 89,983 | 90,275 | 94,067 |
| 2009 | 92,864 | 81,564 | 92,851 | 89,590 | 93,851 | 90,812 | 95,693 | 96,549 | 91,126 | 88,101 | 86,641 | 89,462 |
| 2010 | 82,787 | 76,217 | 96,362 | 90,160 | 91,341 | 92,134 | 96,487 | 92,316 | 83,437 | 83,963 | 85,824 | 95,400 |
| 2011 | 89,583 | 68,072 | 81,106 | 76,961 | 85,292 | 84,791 | 88,259 | 88,919 | 85,821 | 82,603 | 87,627 | 90,878 |
| 2012 | 83,736 | 76,491 | 84,258 | 81,608 | 85,861 | 82,260 | 85,784 | 87,761 | 81,688 | 82,945 | 85,343 | 86,868 |
| 2013 | 78,671 | 73,191 | 77,893 | 77,737 | 88,941 | 88,098 | 95,980 | 87,389 | 85,897 | 87,927 | 88,781 | 92,034 |
| 2014 | 86,719 | 77,884 | 89,413 | 90,053 | 91,638 | 84,630 | 96,316 | 91,846 | 80,530 | 75,179 | 84,658 | 97,243 |
| 2015 | 89,482 | 80,820 | 90,960 | 88,305 | 89,098 | 90,429 | 94,591 | 91,376 | 87,299 | 88,746 | 89,849 | 93,631 |
| 2016 | 79,799 | 73,239 | 91,366 | 83,192 | 85,851 | 86,749 | 93,913 | 91,134 | 82,284 | 81,740 | 86,177 | 92,378 |
| 2017 | 87,939 | 80,586 | 91,499 | 89,844 | 97,306 | 92,015 | 95,980 | 82,153 | 52,018 | 88,991 | 92,672 | 96,640 |
| 2018 | 90,642 | 70,996 | 92,326 | 90,895 | 89,267 | 91,034 | 100,309 | 100,358 | 95,046 | 96,176 | 94,788 | 97,750 |
| 2019 | 92,418 | 78,828 | 90,822 | 85,673 | 89,619 | 92,306 | 96,390 | 93,580 | 81,646 | 80,133 | 88,056 | 95,218 |
| 2020 | 93,663 | 86,943 | 93,523 | 79,467 | 75,186 | 75,841 | 80,195 | 78,186 | 75,999 | 76,357 | 79,845 | 86,307 |
| 2021 | 84,233 | 43,230 | 69,978 | 87,281 | 91,075 | 90,323 | 91,419 | 91,851 | 87,321 | 84,982 | 89,097 | 91,926 |
| 2022 | 83,136 | 75,419 | 94,872 | 94,769 | 102,266 | 97,438 | 100,379 | 97,195 | 95,190 | 90,834 | 95,459 | 85,218 |
| 2023 | 88,177 | 80,071 | 93,666 | 94,827 | 100,207 | 96,615 | 100,078 | 96,251 | 93,103 | 92,234 | 94,236 | 103,629 |
| 2024 | 89,886 | |||||||||||
| - = No Data Reported; -- = Not Applicable; NA = Not Available; W = Withheld to avoid disclosure of individual company data. |
| Release Date: 3/29/2024 |
| Next Release Date: 4/30/2024 |