|
Download Data (XLS File) |
|
||||||||
|
||||||||
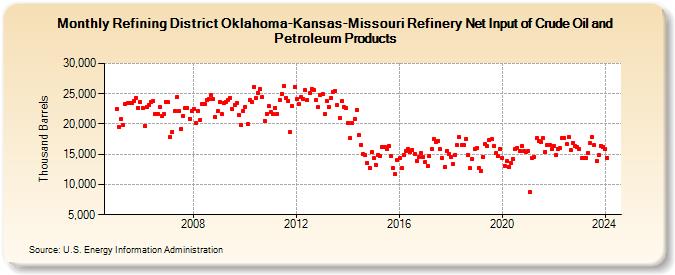
| Refining District Oklahoma-Kansas-Missouri Refinery Net Input of Crude Oil and Petroleum Products (Thousand Barrels) | ||||||||
| Year | Jan | Feb | Mar | Apr | May | Jun | Jul | Aug | Sep | Oct | Nov | Dec |
|---|---|---|---|---|---|---|---|---|---|---|---|---|
| 2005 | 22,477 | 19,514 | 20,861 | 19,908 | 23,235 | 23,416 | 23,539 | 23,545 | 23,875 | 24,361 | 22,717 | 23,550 |
| 2006 | 22,676 | 19,718 | 22,777 | 23,188 | 23,670 | 23,725 | 21,647 | 21,697 | 22,769 | 21,316 | 21,629 | 23,593 |
| 2007 | 23,583 | 17,837 | 18,703 | 22,075 | 24,384 | 22,174 | 19,190 | 21,367 | 22,661 | 22,681 | 20,900 | 22,196 |
| 2008 | 22,448 | 20,096 | 22,138 | 20,703 | 23,270 | 23,330 | 23,984 | 24,169 | 24,804 | 24,157 | 21,147 | 22,133 |
| 2009 | 23,648 | 21,596 | 23,504 | 23,714 | 23,990 | 24,301 | 22,432 | 23,164 | 23,457 | 21,504 | 19,879 | 22,185 |
| 2010 | 22,856 | 19,938 | 23,985 | 23,706 | 26,128 | 24,295 | 25,163 | 25,723 | 24,424 | 20,537 | 21,729 | 22,956 |
| 2011 | 21,910 | 21,635 | 22,687 | 21,697 | 23,894 | 25,008 | 26,300 | 24,345 | 23,784 | 18,623 | 22,942 | 26,162 |
| 2012 | 24,104 | 23,320 | 24,442 | 24,087 | 25,586 | 23,984 | 25,039 | 25,831 | 25,622 | 23,982 | 22,789 | 24,738 |
| 2013 | 24,997 | 21,604 | 23,788 | 22,879 | 24,340 | 25,309 | 25,516 | 23,098 | 20,948 | 23,743 | 22,866 | 22,589 |
| 2014 | 20,218 | 17,705 | 20,148 | 20,889 | 22,270 | 18,148 | 16,568 | 14,983 | 14,789 | 13,512 | 12,797 | 15,302 |
| 2015 | 14,309 | 13,261 | 14,950 | 14,634 | 16,175 | 16,197 | 15,860 | 16,384 | 14,662 | 12,702 | 11,730 | 14,118 |
| 2016 | 14,317 | 12,681 | 14,916 | 15,581 | 15,809 | 15,416 | 15,712 | 15,105 | 13,931 | 14,534 | 15,156 | 14,612 |
| 2017 | 13,747 | 13,038 | 14,741 | 15,832 | 17,472 | 17,087 | 17,260 | 15,803 | 14,392 | 12,863 | 15,612 | 15,044 |
| 2018 | 14,622 | 13,457 | 14,933 | 16,453 | 17,828 | 16,586 | 16,603 | 17,530 | 14,859 | 12,641 | 14,244 | 15,823 |
| 2019 | 16,044 | 12,748 | 12,145 | 14,551 | 16,625 | 16,315 | 17,292 | 17,453 | 16,344 | 15,189 | 14,693 | 15,822 |
| 2020 | 14,420 | 13,079 | 13,876 | 12,806 | 13,607 | 14,140 | 15,838 | 16,005 | 15,563 | 16,321 | 15,460 | 15,414 |
| 2021 | 15,561 | 8,716 | 14,353 | 14,577 | 17,654 | 17,178 | 17,013 | 17,637 | 15,444 | 16,446 | 16,563 | 15,805 |
| 2022 | 16,382 | 14,860 | 15,937 | 16,011 | 17,622 | 17,669 | 16,633 | 17,861 | 15,648 | 16,902 | 16,358 | 16,223 |
| 2023 | 15,857 | 14,374 | 14,420 | 14,420 | 15,236 | 16,798 | 17,843 | 16,464 | 13,909 | 14,835 | 16,435 | 16,255 |
| 2024 | 15,781 | |||||||||||
| - = No Data Reported; -- = Not Applicable; NA = Not Available; W = Withheld to avoid disclosure of individual company data. |
| Release Date: 3/29/2024 |
| Next Release Date: 4/30/2024 |