|
Download Data (XLS File) |
|
||||||||
|
||||||||
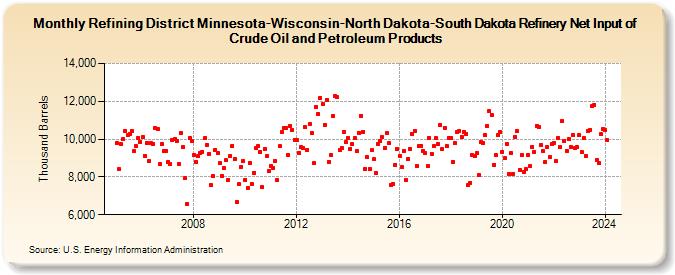
| Refining District Minnesota-Wisconsin-North Dakota-South Dakota Refinery Net Input of Crude Oil and Petroleum Products (Thousand Barrels) | ||||||||
| Year | Jan | Feb | Mar | Apr | May | Jun | Jul | Aug | Sep | Oct | Nov | Dec |
|---|---|---|---|---|---|---|---|---|---|---|---|---|
| 2005 | 9,773 | 8,399 | 9,730 | 9,996 | 10,434 | 10,195 | 10,279 | 10,430 | 9,366 | 9,624 | 10,075 | 9,862 |
| 2006 | 10,121 | 9,110 | 9,785 | 8,830 | 9,771 | 9,764 | 10,600 | 10,525 | 8,662 | 9,756 | 9,385 | 9,384 |
| 2007 | 8,813 | 8,684 | 9,937 | 10,003 | 9,916 | 8,701 | 10,319 | 9,568 | 7,940 | 6,567 | 10,062 | 9,876 |
| 2008 | 9,165 | 8,799 | 9,095 | 9,248 | 9,328 | 10,044 | 9,709 | 9,220 | 7,547 | 8,036 | 9,440 | 9,260 |
| 2009 | 8,716 | 8,065 | 8,452 | 8,869 | 7,858 | 9,123 | 9,657 | 8,962 | 6,683 | 7,605 | 8,537 | 8,846 |
| 2010 | 7,858 | 7,410 | 8,741 | 7,619 | 8,227 | 9,507 | 9,617 | 9,300 | 7,463 | 9,495 | 9,089 | 8,315 |
| 2011 | 8,564 | 8,490 | 8,854 | 7,843 | 9,612 | 10,376 | 10,592 | 10,597 | 9,148 | 10,703 | 10,474 | 9,972 |
| 2012 | 9,971 | 9,274 | 9,579 | 9,512 | 10,614 | 9,425 | 10,780 | 10,320 | 8,725 | 11,724 | 11,344 | 12,181 |
| 2013 | 11,850 | 10,769 | 12,066 | 8,810 | 9,163 | 11,247 | 12,291 | 12,201 | 9,439 | 9,549 | 10,401 | 9,828 |
| 2014 | 10,083 | 9,494 | 9,749 | 10,062 | 9,362 | 10,344 | 11,224 | 10,391 | 8,426 | 9,039 | 8,419 | 9,401 |
| 2015 | 8,926 | 8,210 | 9,753 | 9,919 | 10,111 | 9,542 | 10,312 | 9,773 | 7,577 | 7,634 | 8,650 | 9,450 |
| 2016 | 9,113 | 8,504 | 9,370 | 7,850 | 8,968 | 9,484 | 10,291 | 10,438 | 8,602 | 9,614 | 9,649 | 9,358 |
| 2017 | 9,255 | 8,589 | 10,056 | 9,234 | 9,617 | 10,048 | 9,760 | 10,765 | 9,470 | 10,610 | 9,613 | 10,081 |
| 2018 | 10,083 | 8,802 | 9,785 | 10,351 | 10,433 | 10,136 | 10,400 | 10,274 | 7,568 | 7,704 | 9,146 | 9,110 |
| 2019 | 9,271 | 8,102 | 9,844 | 9,787 | 10,193 | 10,698 | 11,462 | 11,297 | 8,644 | 9,141 | 10,227 | 10,392 |
| 2020 | 9,335 | 8,980 | 9,749 | 8,161 | 9,258 | 8,163 | 10,132 | 10,427 | 8,386 | 9,159 | 8,269 | 8,397 |
| 2021 | 9,152 | 8,555 | 9,586 | 9,326 | 10,716 | 10,620 | 9,695 | 9,368 | 8,789 | 9,561 | 9,066 | 9,733 |
| 2022 | 9,819 | 8,847 | 10,084 | 9,589 | 10,968 | 9,900 | 9,395 | 10,002 | 9,556 | 10,218 | 9,530 | 9,568 |
| 2023 | 10,195 | 9,309 | 10,075 | 9,093 | 10,432 | 10,499 | 11,826 | 11,817 | 8,916 | 8,724 | 10,268 | 10,511 |
| 2024 | 10,487 | 9,937 | 11,257 | 9,928 | 12,039 | 10,866 | ||||||
| - = No Data Reported; -- = Not Applicable; NA = Not Available; W = Withheld to avoid disclosure of individual company data. |
| Release Date: 8/30/2024 |
| Next Release Date: 9/30/2024 |