|
Download Data (XLS File) |
|
||||||||
|
||||||||
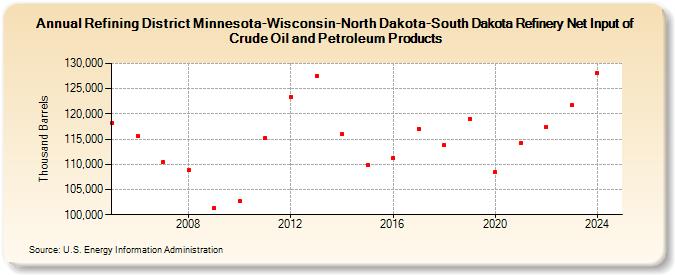
| Refining District Minnesota-Wisconsin-North Dakota-South Dakota Refinery Net Input of Crude Oil and Petroleum Products (Thousand Barrels) | ||||||||
| Decade | Year-0 | Year-1 | Year-2 | Year-3 | Year-4 | Year-5 | Year-6 | Year-7 | Year-8 | Year-9 |
|---|---|---|---|---|---|---|---|---|---|---|
| 2000's | 118,163 | 115,693 | 110,386 | 108,891 | 101,373 | |||||
| 2010's | 102,641 | 115,225 | 123,449 | 127,614 | 115,994 | 109,857 | 111,241 | 117,098 | 113,792 | 119,058 |
| 2020's | 108,416 | 114,167 | 117,476 | 121,600 |
| - = No Data Reported; -- = Not Applicable; NA = Not Available; W = Withheld to avoid disclosure of individual company data. |
| Release Date: 3/29/2024 |
| Next Release Date: 8/30/2024 |