|
Download Data (XLS File) |
|
||||||||
|
||||||||
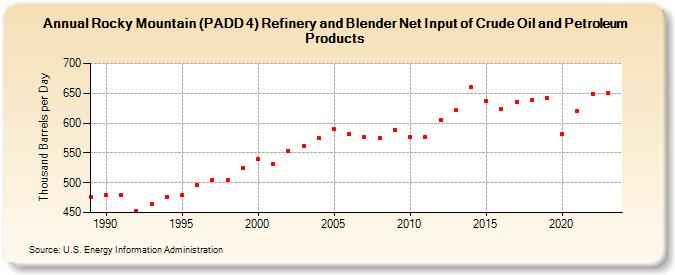
| Rocky Mountain (PADD 4) Refinery and Blender Net Input of Crude Oil and Petroleum Products (Thousand Barrels per Day) | ||||||||
| Decade | Year-0 | Year-1 | Year-2 | Year-3 | Year-4 | Year-5 | Year-6 | Year-7 | Year-8 | Year-9 |
|---|---|---|---|---|---|---|---|---|---|---|
| 1980's | 476 | |||||||||
| 1990's | 480 | 479 | 453 | 465 | 476 | 479 | 496 | 505 | 504 | 524 |
| 2000's | 539 | 532 | 554 | 562 | 575 | 590 | 581 | 577 | 575 | 589 |
| 2010's | 577 | 577 | 606 | 622 | 660 | 637 | 623 | 636 | 638 | 642 |
| 2020's | 582 | 620 | 649 | 651 |
| - = No Data Reported; -- = Not Applicable; NA = Not Available; W = Withheld to avoid disclosure of individual company data. |
| Release Date: 3/29/2024 |
| Next Release Date: 8/30/2024 |