|
Download Data (XLS File) |
|
||||||||
|
||||||||
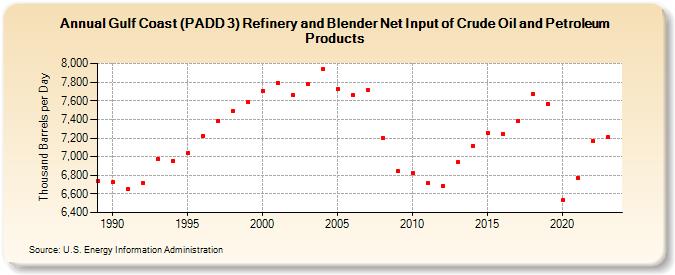
| Gulf Coast (PADD 3) Refinery and Blender Net Input of Crude Oil and Petroleum Products (Thousand Barrels per Day) | ||||||||
| Decade | Year-0 | Year-1 | Year-2 | Year-3 | Year-4 | Year-5 | Year-6 | Year-7 | Year-8 | Year-9 |
|---|---|---|---|---|---|---|---|---|---|---|
| 1980's | 6,739 | |||||||||
| 1990's | 6,724 | 6,658 | 6,721 | 6,976 | 6,956 | 7,040 | 7,224 | 7,384 | 7,494 | 7,584 |
| 2000's | 7,706 | 7,795 | 7,664 | 7,784 | 7,937 | 7,728 | 7,665 | 7,720 | 7,205 | 6,846 |
| 2010's | 6,823 | 6,719 | 6,689 | 6,943 | 7,118 | 7,257 | 7,247 | 7,383 | 7,676 | 7,567 |
| 2020's | 6,537 | 6,774 | 7,167 | 7,209 |
| - = No Data Reported; -- = Not Applicable; NA = Not Available; W = Withheld to avoid disclosure of individual company data. |
| Release Date: 8/30/2024 |
| Next Release Date: 8/29/2025 |