|
Download Data (XLS File) |
|
||||||||
|
||||||||
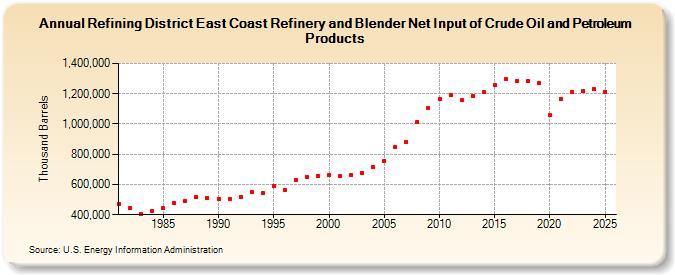
| Refining District East Coast Refinery and Blender Net Input of Crude Oil and Petroleum Products (Thousand Barrels) | ||||||||
| Decade | Year-0 | Year-1 | Year-2 | Year-3 | Year-4 | Year-5 | Year-6 | Year-7 | Year-8 | Year-9 |
|---|---|---|---|---|---|---|---|---|---|---|
| 1980's | 470,657 | 445,952 | 403,119 | 424,752 | 442,373 | 477,746 | 492,505 | 518,359 | 511,318 | |
| 1990's | 503,005 | 504,699 | 518,420 | 549,254 | 541,801 | 592,101 | 563,314 | 631,115 | 651,617 | 656,264 |
| 2000's | 661,975 | 653,870 | 661,174 | 678,842 | 715,865 | 758,261 | 848,987 | 882,309 | 1,014,133 | 1,102,348 |
| 2010's | 1,165,034 | 1,194,771 | 1,155,285 | 1,183,808 | 1,208,761 | 1,255,804 | 1,295,522 | 1,285,633 | 1,285,470 | 1,272,312 |
| 2020's | 1,056,161 | 1,166,656 | 1,210,787 | 1,215,542 |
| - = No Data Reported; -- = Not Applicable; NA = Not Available; W = Withheld to avoid disclosure of individual company data. |
| Release Date: 3/29/2024 |
| Next Release Date: 8/30/2024 |