|
Download Data (XLS File) |
|
||||||||
|
||||||||
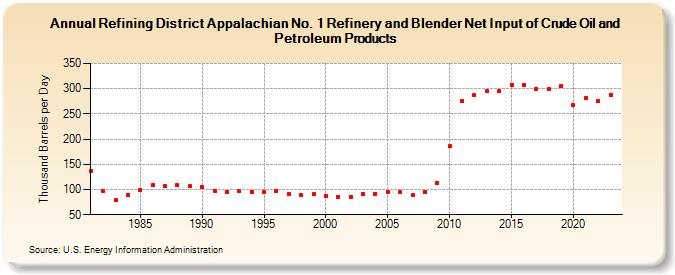
| Refining District Appalachian No. 1 Refinery and Blender Net Input of Crude Oil and Petroleum Products (Thousand Barrels per Day) | ||||||||
| Decade | Year-0 | Year-1 | Year-2 | Year-3 | Year-4 | Year-5 | Year-6 | Year-7 | Year-8 | Year-9 |
|---|---|---|---|---|---|---|---|---|---|---|
| 1980's | 136 | 97 | 79 | 89 | 99 | 109 | 106 | 108 | 106 | |
| 1990's | 104 | 98 | 96 | 97 | 96 | 96 | 98 | 91 | 89 | 91 |
| 2000's | 87 | 86 | 86 | 91 | 92 | 96 | 95 | 89 | 96 | 113 |
| 2010's | 186 | 275 | 287 | 295 | 295 | 308 | 308 | 300 | 299 | 306 |
| 2020's | 267 | 282 | 275 | 290 |
| - = No Data Reported; -- = Not Applicable; NA = Not Available; W = Withheld to avoid disclosure of individual company data. |
| Release Date: 8/30/2024 |
| Next Release Date: 8/29/2025 |