|
Download Data (XLS File) |
|
||||||||
|
||||||||
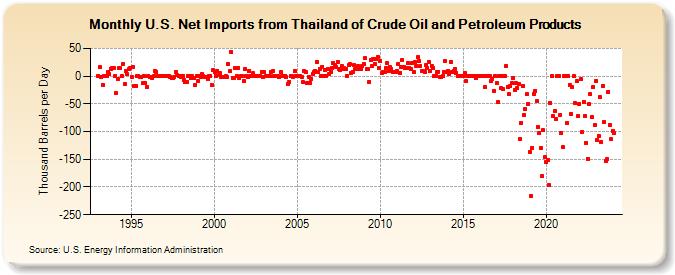
| U.S. Net Imports from Thailand of Crude Oil and Petroleum Products (Thousand Barrels per Day) | ||||||||
| Year | Jan | Feb | Mar | Apr | May | Jun | Jul | Aug | Sep | Oct | Nov | Dec |
|---|---|---|---|---|---|---|---|---|---|---|---|---|
| 1993 | 0 | 16 | -1 | -16 | 0 | 0 | 0 | 8 | 4 | 13 | 14 | 15 |
| 1994 | 0 | -31 | -5 | 15 | 14 | 0 | 22 | -14 | 9 | 3 | 12 | 15 |
| 1995 | -1 | 17 | -18 | -17 | 0 | 0 | -1 | -1 | -13 | 0 | -13 | -19 |
| 1996 | 0 | -2 | -1 | -3 | 0 | 9 | 8 | 0 | 0 | 0 | 0 | 0 |
| 1997 | 0 | 0 | 0 | 0 | -1 | -3 | -3 | -2 | 7 | 2 | 0 | 0 |
| 1998 | -2 | 0 | -7 | -10 | -10 | 0 | 0 | -4 | 0 | -4 | -16 | 0 |
| 1999 | -8 | 0 | -1 | 4 | 0 | -1 | -1 | -5 | 0 | 0 | -16 | 11 |
| 2000 | 7 | 0 | 10 | 2 | 5 | -2 | -2 | -2 | 0 | -2 | 22 | 9 |
| 2001 | 44 | -3 | -3 | 14 | 0 | 15 | -4 | 0 | 0 | -9 | 13 | 0 |
| 2002 | -1 | 10 | 0 | 0 | 5 | 0 | 0 | 0 | 0 | 1 | 8 | -2 |
| 2003 | 7 | 0 | 1 | 0 | 0 | 8 | 9 | 0 | 0 | 0 | 0 | -1 |
| 2004 | 7 | 0 | 0 | 0 | -2 | -14 | -10 | 0 | 0 | -1 | 10 | 1 |
| 2005 | 0 | 0 | 0 | -1 | -11 | 9 | 7 | -12 | -1 | -12 | -5 | 4 |
| 2006 | 8 | 10 | 26 | 8 | 13 | 1 | 17 | 0 | 11 | 0 | 12 | 4 |
| 2007 | 8 | 14 | 24 | 20 | 16 | 26 | 12 | 11 | 18 | 13 | 14 | 13 |
| 2008 | 0 | 20 | 21 | 5 | 8 | 20 | 12 | 13 | 18 | 12 | 12 | 19 |
| 2009 | 22 | 32 | 13 | 12 | -10 | 29 | 18 | 30 | 22 | 31 | 35 | 15 |
| 2010 | 28 | 6 | 7 | 8 | 15 | 23 | 9 | 16 | 13 | 8 | 8 | 7 |
| 2011 | 10 | 22 | 6 | 16 | 29 | 16 | 15 | 15 | 23 | 14 | 13 | 24 |
| 2012 | 7 | 26 | 19 | 34 | 27 | 19 | 9 | 10 | 8 | 20 | 15 | 26 |
| 2013 | 9 | 19 | 15 | 0 | 1 | 7 | 8 | -2 | -1 | 0 | 7 | 27 |
| 2014 | 7 | 9 | 3 | 26 | 8 | 9 | 12 | 6 | 0 | 0 | 0 | 0 |
| 2015 | 0 | 6 | -9 | 0 | 0 | 0 | 0 | 0 | 0 | -4 | 0 | 0 |
| 2016 | 0 | 0 | 0 | 0 | -20 | 0 | 0 | 0 | -9 | -5 | -26 | 0 |
| 2017 | -12 | -47 | 0 | -22 | 0 | -24 | 0 | 18 | -19 | -33 | -18 | -13 |
| 2018 | -3 | -25 | -13 | -21 | -14 | -114 | -84 | -18 | -70 | -60 | -33 | -50 |
| 2019 | -136 | -216 | -130 | -32 | -26 | -45 | -91 | -102 | -130 | -180 | -98 | -146 |
| 2020 | -155 | -152 | -197 | -48 | 0 | -72 | -63 | -77 | 0 | 0 | -70 | -102 |
| 2021 | -128 | 0 | 0 | -85 | 0 | -16 | -68 | -20 | 0 | -49 | -9 | -72 |
| 2022 | -50 | -6 | -100 | -46 | -72 | -120 | -149 | -51 | -33 | -74 | -19 | -88 |
| 2023 | -8 | -115 | -108 | -38 | -119 | -17 | -83 | -154 | -150 | -28 | -88 | -114 |
| 2024 | -99 | |||||||||||
| - = No Data Reported; -- = Not Applicable; NA = Not Available; W = Withheld to avoid disclosure of individual company data. |
| Release Date: 3/29/2024 |
| Next Release Date: 4/30/2024 |