|
Download Data (XLS File) |
|
||||||||
|
||||||||
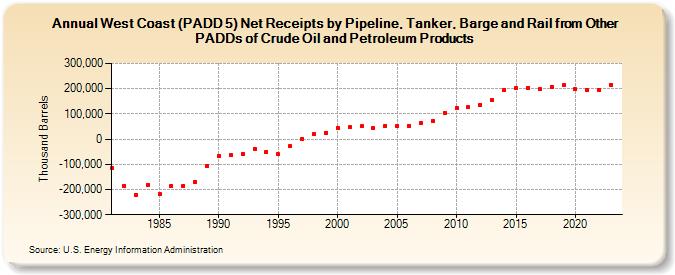
| West Coast (PADD 5) Net Receipts by Pipeline, Tanker, Barge and Rail from Other PADDs of Crude Oil and Petroleum Products (Thousand Barrels) | ||||||||
| Decade | Year-0 | Year-1 | Year-2 | Year-3 | Year-4 | Year-5 | Year-6 | Year-7 | Year-8 | Year-9 |
|---|---|---|---|---|---|---|---|---|---|---|
| 1980's | -115,560 | -184,502 | -219,908 | -180,787 | -215,958 | -186,071 | -184,206 | -170,043 | -107,694 | |
| 1990's | -65,417 | -64,815 | -59,997 | -38,150 | -50,068 | -60,573 | -28,891 | 2,095 | 20,100 | 25,542 |
| 2000's | 45,401 | 46,423 | 50,390 | 42,564 | 53,136 | 52,649 | 53,943 | 64,579 | 72,213 | 104,688 |
| 2010's | 122,615 | 125,647 | 136,932 | 154,557 | 195,034 | 200,850 | 203,136 | 197,498 | 207,990 | 213,490 |
| 2020's | 198,055 | 194,797 | 194,917 | 215,776 |
| - = No Data Reported; -- = Not Applicable; NA = Not Available; W = Withheld to avoid disclosure of individual company data. |
| Release Date: 4/30/2024 |
| Next Release Date: 8/30/2024 |