|
Download Data (XLS File) |
|
||||||||
|
||||||||
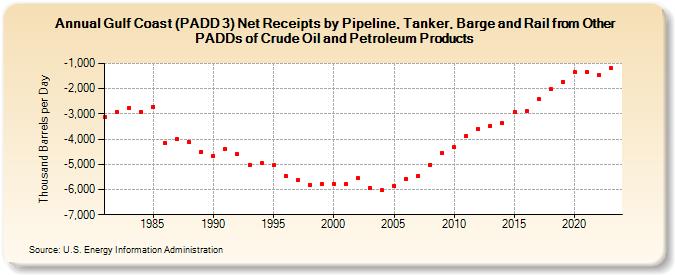
| Gulf Coast (PADD 3) Net Receipts by Pipeline, Tanker, Barge and Rail from Other PADDs of Crude Oil and Petroleum Products (Thousand Barrels per Day) | ||||||||
| Decade | Year-0 | Year-1 | Year-2 | Year-3 | Year-4 | Year-5 | Year-6 | Year-7 | Year-8 | Year-9 |
|---|---|---|---|---|---|---|---|---|---|---|
| 1980's | -3,112 | -2,916 | -2,760 | -2,916 | -2,712 | -4,151 | -4,011 | -4,119 | -4,499 | |
| 1990's | -4,677 | -4,403 | -4,602 | -5,009 | -4,959 | -5,043 | -5,455 | -5,634 | -5,805 | -5,777 |
| 2000's | -5,774 | -5,791 | -5,560 | -5,932 | -6,034 | -5,847 | -5,581 | -5,446 | -5,008 | -4,558 |
| 2010's | -4,331 | -3,875 | -3,599 | -3,475 | -3,367 | -2,931 | -2,883 | -2,421 | -2,024 | -1,727 |
| 2020's | -1,354 | -1,331 | -1,467 | -1,194 |
| - = No Data Reported; -- = Not Applicable; NA = Not Available; W = Withheld to avoid disclosure of individual company data. |
| Release Date: 3/29/2024 |
| Next Release Date: 8/30/2024 |