|
Download Data (XLS File) |
|
||||||||
|
||||||||
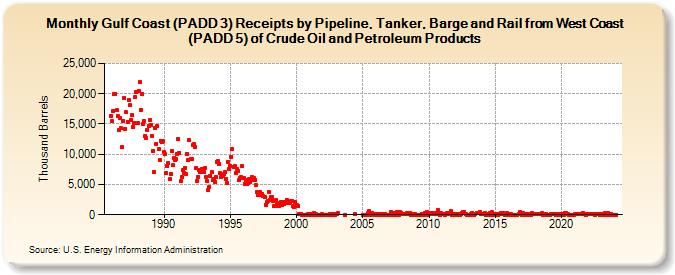
| Gulf Coast (PADD 3) Receipts by Pipeline, Tanker, Barge and Rail from West Coast (PADD 5) of Crude Oil and Petroleum Products (Thousand Barrels) | ||||||||
| Year | Jan | Feb | Mar | Apr | May | Jun | Jul | Aug | Sep | Oct | Nov | Dec |
|---|---|---|---|---|---|---|---|---|---|---|---|---|
| 1986 | 16,339 | 15,441 | 17,195 | 19,918 | 20,011 | 17,237 | 16,300 | 13,959 | 15,977 | 14,288 | 11,166 | 15,546 |
| 1987 | 19,253 | 14,246 | 16,910 | 15,334 | 18,887 | 18,074 | 15,632 | 16,475 | 14,561 | 15,200 | 19,469 | 20,219 |
| 1988 | 15,160 | 20,470 | 21,930 | 17,384 | 19,924 | 15,059 | 15,457 | 12,989 | 12,653 | 14,071 | 14,638 | 15,580 |
| 1989 | 14,854 | 13,080 | 10,536 | 7,059 | 14,302 | 11,736 | 14,662 | 10,809 | 9,094 | 12,261 | 11,975 | 12,203 |
| 1990 | 10,313 | 9,978 | 6,859 | 8,036 | 8,476 | 5,867 | 6,765 | 10,537 | 8,173 | 9,441 | 9,105 | 9,163 |
| 1991 | 10,024 | 12,521 | 10,266 | 5,508 | 6,263 | 7,319 | 6,845 | 7,745 | 6,751 | 10,099 | 8,973 | 12,330 |
| 1992 | 9,196 | 9,268 | 11,572 | 11,613 | 11,152 | 7,741 | 5,599 | 6,315 | 7,439 | 6,980 | 7,573 | 7,124 |
| 1993 | 7,086 | 7,735 | 6,305 | 5,510 | 4,025 | 4,663 | 6,464 | 7,033 | 5,669 | 5,953 | 5,466 | 6,258 |
| 1994 | 8,774 | 8,841 | 8,376 | 6,952 | 6,282 | 6,327 | 6,724 | 7,030 | 5,983 | 5,239 | 8,783 | 7,632 |
| 1995 | 8,099 | 9,623 | 10,824 | 7,956 | 8,006 | 6,888 | 7,631 | 7,224 | 5,738 | 6,110 | 6,243 | 8,027 |
| 1996 | 6,133 | 5,113 | 5,821 | 5,081 | 5,286 | 5,932 | 5,337 | 5,777 | 6,225 | 6,031 | 5,714 | 4,918 |
| 1997 | 3,792 | 3,244 | 3,587 | 3,680 | 3,322 | 3,425 | 3,032 | 2,863 | 1,667 | 2,096 | 2,285 | 3,832 |
| 1998 | 2,428 | 2,920 | 2,888 | 2,195 | 1,488 | 2,379 | 1,729 | 1,499 | 1,404 | 1,968 | 2,137 | 1,577 |
| 1999 | 2,046 | 1,777 | 2,116 | 2,466 | 1,951 | 1,962 | 2,029 | 2,224 | 2,343 | 1,429 | 1,271 | 2,044 |
| 2000 | 1,567 | 1,422 | 161 | 43 | 90 | 0 | 28 | 0 | 10 | 30 | 38 | 55 |
| 2001 | 0 | 0 | 65 | 0 | 260 | 0 | 43 | 0 | 0 | 0 | 33 | 58 |
| 2002 | 0 | 0 | 0 | 0 | 0 | 0 | 61 | 0 | 48 | 0 | 43 | 0 |
| 2003 | 133 | 225 | 25 | |||||||||
| 2004 | 61 | |||||||||||
| 2005 | 0 | 0 | 0 | 0 | 0 | 230 | 559 | 0 | 314 | 148 | 0 | 57 |
| 2006 | 59 | 0 | 171 | 0 | 140 | 1 | 149 | 0 | 41 | 0 | 0 | 0 |
| 2007 | 0 | 0 | 382 | 0 | 250 | 325 | 0 | 459 | 0 | 0 | 449 | 256 |
| 2008 | 57 | 95 | 65 | 60 | 365 | 117 | 62 | 210 | 0 | 165 | 0 | 123 |
| 2009 | 0 | 3 | 0 | 0 | 0 | 0 | 97 | 0 | 205 | 355 | 443 | 0 |
| 2010 | 244 | 65 | 249 | 219 | 60 | 249 | 295 | 137 | 699 | 130 | 0 | 203 |
| 2011 | 49 | 199 | 0 | 187 | 217 | 335 | 141 | 171 | 543 | 0 | 139 | 0 |
| 2012 | 76 | 0 | 73 | 59 | 25 | 184 | 215 | 381 | 518 | 70 | 0 | 24 |
| 2013 | 0 | 0 | 50 | 272 | 139 | 0 | 176 | 296 | 247 | 203 | 396 | 89 |
| 2014 | 137 | 80 | 132 | 213 | 30 | 190 | 5 | 267 | 0 | 459 | 24 | 79 |
| 2015 | 0 | 142 | 10 | 182 | 75 | 326 | 44 | 268 | 50 | 31 | 0 | 279 |
| 2016 | 134 | 4 | 89 | 5 | 29 | 30 | 4 | 6 | 30 | 54 | 485 | 47 |
| 2017 | 0 | 242 | 0 | 170 | 0 | 90 | 26 | 152 | 25 | 211 | 50 | 115 |
| 2018 | 50 | 155 | 75 | 183 | 145 | 100 | 209 | 25 | 117 | 77 | 75 | 25 |
| 2019 | 0 | 0 | 42 | 73 | 143 | 96 | 146 | 25 | 138 | 0 | 25 | 186 |
| 2020 | 74 | 25 | 0 | 203 | 318 | 175 | 50 | 25 | 19 | 0 | 0 | 28 |
| 2021 | 118 | 124 | 47 | 180 | 37 | 44 | 49 | 222 | 84 | 177 | 3 | 36 |
| 2022 | 52 | 42 | 125 | 132 | 46 | 82 | 35 | 61 | 74 | 51 | 55 | 26 |
| 2023 | 64 | 23 | 183 | 216 | 28 | 32 | 243 | 26 | 10 | 91 | 13 | 19 |
| 2024 | 16 | |||||||||||
| - = No Data Reported; -- = Not Applicable; NA = Not Available; W = Withheld to avoid disclosure of individual company data. |
| Release Date: 3/29/2024 |
| Next Release Date: 4/30/2024 |