|
Download Data (XLS File) |
|
||||||||
|
||||||||
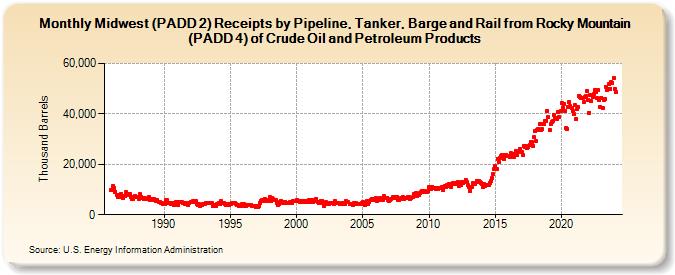
| Midwest (PADD 2) Receipts by Pipeline, Tanker, Barge and Rail from Rocky Mountain (PADD 4) of Crude Oil and Petroleum Products (Thousand Barrels) | ||||||||
| Year | Jan | Feb | Mar | Apr | May | Jun | Jul | Aug | Sep | Oct | Nov | Dec |
|---|---|---|---|---|---|---|---|---|---|---|---|---|
| 1986 | 9,898 | 9,629 | 11,355 | 10,595 | 9,176 | 8,008 | 7,095 | 7,647 | 7,356 | 8,372 | 7,064 | 6,542 |
| 1987 | 7,562 | 7,495 | 8,943 | 7,893 | 8,398 | 8,327 | 6,959 | 6,199 | 6,133 | 6,927 | 7,591 | 7,134 |
| 1988 | 7,002 | 6,384 | 8,086 | 7,172 | 6,659 | 6,822 | 6,220 | 6,504 | 6,042 | 6,039 | 7,014 | 6,019 |
| 1989 | 6,188 | 5,726 | 6,130 | 6,249 | 5,909 | 5,370 | 5,796 | 5,005 | 5,011 | 4,586 | 4,472 | 4,200 |
| 1990 | 4,449 | 4,357 | 5,718 | 5,729 | 4,791 | 4,644 | 4,100 | 4,781 | 4,342 | 3,711 | 4,572 | 5,000 |
| 1991 | 5,192 | 3,917 | 5,041 | 5,114 | 5,022 | 4,816 | 4,624 | 4,382 | 4,466 | 4,191 | 3,973 | 4,475 |
| 1992 | 4,976 | 5,002 | 5,309 | 5,010 | 5,219 | 5,315 | 4,391 | 3,978 | 4,184 | 3,287 | 3,951 | 4,235 |
| 1993 | 4,405 | 4,070 | 4,807 | 4,450 | 4,584 | 4,708 | 4,570 | 4,678 | 3,409 | 3,816 | 3,709 | 3,633 |
| 1994 | 4,228 | 4,120 | 4,764 | 4,334 | 5,247 | 4,689 | 4,763 | 4,393 | 4,009 | 3,816 | 4,182 | 3,898 |
| 1995 | 4,431 | 4,143 | 4,681 | 4,587 | 4,540 | 4,195 | 3,923 | 3,822 | 3,602 | 3,268 | 3,608 | 4,074 |
| 1996 | 4,165 | 3,515 | 3,366 | 3,715 | 3,742 | 3,775 | 3,881 | 3,822 | 3,319 | 3,380 | 3,426 | 3,120 |
| 1997 | 3,416 | 3,025 | 3,525 | 4,453 | 5,499 | 5,875 | 5,464 | 6,239 | 5,830 | 5,538 | 5,723 | 5,949 |
| 1998 | 6,896 | 5,471 | 6,493 | 6,167 | 5,903 | 5,645 | 4,650 | 3,721 | 4,273 | 5,027 | 5,560 | 5,138 |
| 1999 | 4,768 | 4,551 | 5,231 | 4,583 | 4,682 | 4,796 | 5,071 | 4,755 | 4,732 | 5,353 | 5,258 | 5,476 |
| 2000 | 5,906 | 5,378 | 5,386 | 5,094 | 5,320 | 5,090 | 5,255 | 5,420 | 5,159 | 5,566 | 5,154 | 5,665 |
| 2001 | 5,169 | 5,254 | 5,861 | 5,118 | 5,719 | 5,518 | 6,170 | 5,159 | 4,732 | 5,160 | 5,583 | 5,549 |
| 2002 | 4,633 | 3,598 | 4,837 | 4,932 | 4,358 | 4,415 | 4,697 | 4,704 | 4,623 | 4,610 | 4,375 | 5,434 |
| 2003 | 4,830 | 4,481 | 4,605 | 4,121 | 4,349 | 4,618 | 4,279 | 4,714 | 4,391 | 5,345 | 4,937 | 4,928 |
| 2004 | 4,416 | 4,197 | 4,136 | 3,767 | 4,634 | 4,227 | 4,632 | 4,059 | 4,245 | 4,092 | 4,186 | 4,688 |
| 2005 | 4,997 | 4,697 | 3,735 | 4,660 | 5,536 | 4,160 | 5,152 | 5,822 | 6,068 | 5,853 | 6,056 | 5,917 |
| 2006 | 6,624 | 5,505 | 5,906 | 5,989 | 6,635 | 6,281 | 5,971 | 7,553 | 6,720 | 6,545 | 6,722 | 5,842 |
| 2007 | 5,540 | 5,859 | 6,401 | 6,885 | 7,109 | 6,706 | 6,851 | 7,202 | 5,909 | 6,013 | 6,397 | 6,662 |
| 2008 | 6,836 | 6,245 | 6,522 | 6,624 | 6,793 | 6,917 | 6,907 | 6,342 | 6,721 | 6,867 | 8,265 | 8,301 |
| 2009 | 8,791 | 7,474 | 8,233 | 7,904 | 8,430 | 9,192 | 9,547 | 9,507 | 8,822 | 9,143 | 9,058 | 9,493 |
| 2010 | 10,859 | 10,342 | 10,192 | 11,026 | 10,436 | 10,414 | 10,027 | 10,518 | 10,016 | 10,596 | 10,671 | 10,714 |
| 2011 | 10,915 | 9,881 | 11,511 | 10,864 | 11,644 | 11,517 | 12,265 | 12,032 | 10,934 | 12,234 | 12,389 | 12,148 |
| 2012 | 12,556 | 12,090 | 13,055 | 11,337 | 12,682 | 11,789 | 12,786 | 12,605 | 12,949 | 13,897 | 13,100 | 11,828 |
| 2013 | 11,081 | 9,564 | 11,101 | 11,050 | 12,484 | 12,199 | 12,265 | 13,412 | 13,100 | 13,381 | 13,171 | 12,732 |
| 2014 | 12,072 | 10,799 | 12,116 | 11,544 | 11,986 | 11,798 | 11,891 | 12,552 | 13,347 | 14,556 | 16,118 | 18,323 |
| 2015 | 19,267 | 17,962 | 22,295 | 20,930 | 22,568 | 23,116 | 23,849 | 22,840 | 22,071 | 23,876 | 23,685 | 23,482 |
| 2016 | 23,117 | 22,726 | 24,341 | 24,032 | 24,220 | 23,022 | 23,654 | 25,188 | 23,582 | 24,705 | 26,073 | 25,030 |
| 2017 | 24,885 | 23,497 | 27,361 | 27,017 | 27,288 | 26,543 | 26,782 | 27,659 | 28,951 | 28,731 | 27,193 | 30,669 |
| 2018 | 33,244 | 29,410 | 33,729 | 34,054 | 35,939 | 33,760 | 33,995 | 36,038 | 36,157 | 37,122 | 37,319 | 41,088 |
| 2019 | 38,731 | 33,714 | 35,799 | 36,790 | 37,166 | 39,619 | 38,560 | 38,206 | 38,055 | 40,656 | 38,695 | 41,141 |
| 2020 | 44,223 | 42,459 | 43,819 | 41,264 | 34,599 | 34,129 | 42,589 | 44,683 | 43,074 | 42,466 | 41,088 | 39,822 |
| 2021 | 43,361 | 38,004 | 42,007 | 42,613 | 47,244 | 46,758 | 46,438 | 46,348 | 44,578 | 46,558 | 46,968 | 49,095 |
| 2022 | 45,475 | 40,531 | 47,584 | 45,092 | 46,745 | 47,815 | 49,327 | 48,607 | 46,368 | 49,466 | 45,388 | 42,855 |
| 2023 | 46,355 | 42,535 | 45,703 | 45,713 | 50,854 | 49,668 | 49,763 | 51,763 | 50,056 | 52,609 | 52,391 | 54,335 |
| 2024 | 49,952 | 48,757 | 53,751 | 52,355 | 55,067 | 52,069 | ||||||
| - = No Data Reported; -- = Not Applicable; NA = Not Available; W = Withheld to avoid disclosure of individual company data. |
| Release Date: 8/30/2024 |
| Next Release Date: 9/30/2024 |