|
Download Data (XLS File) |
|
||||||||
|
||||||||
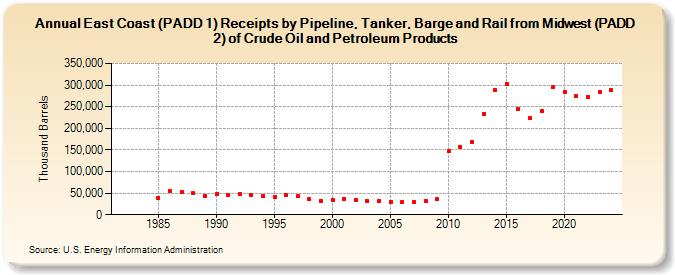
| East Coast (PADD 1) Receipts by Pipeline, Tanker, Barge and Rail from Midwest (PADD 2) of Crude Oil and Petroleum Products (Thousand Barrels) | ||||||||
| Decade | Year-0 | Year-1 | Year-2 | Year-3 | Year-4 | Year-5 | Year-6 | Year-7 | Year-8 | Year-9 |
|---|---|---|---|---|---|---|---|---|---|---|
| 1980's | NA | NA | NA | NA | 39,486 | 54,502 | 53,395 | 49,308 | 44,213 | |
| 1990's | 48,513 | 46,704 | 47,021 | 46,620 | 42,308 | 41,946 | 44,702 | 42,332 | 35,359 | 31,494 |
| 2000's | 34,878 | 36,607 | 34,792 | 30,782 | 32,585 | 30,468 | 29,648 | 30,317 | 32,277 | 36,336 |
| 2010's | 148,093 | 156,940 | 167,634 | 233,863 | 288,305 | 302,497 | 243,760 | 222,765 | 239,750 | 294,697 |
| 2020's | 283,407 | 274,088 | 273,278 | 280,646 |
| - = No Data Reported; -- = Not Applicable; NA = Not Available; W = Withheld to avoid disclosure of individual company data. |
| Release Date: 3/29/2024 |
| Next Release Date: 8/30/2024 |