|
Download Data (XLS File) |
|
||||||||
|
||||||||
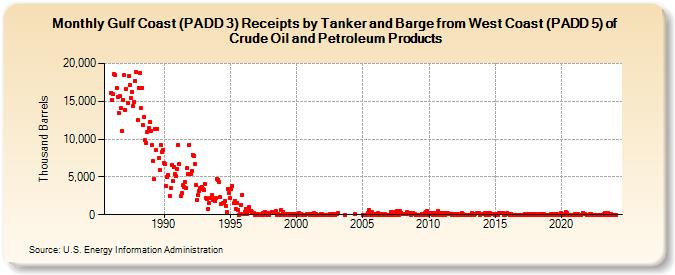
| Gulf Coast (PADD 3) Receipts by Tanker and Barge from West Coast (PADD 5) of Crude Oil and Petroleum Products (Thousand Barrels) | ||||||||
| Year | Jan | Feb | Mar | Apr | May | Jun | Jul | Aug | Sep | Oct | Nov | Dec |
|---|---|---|---|---|---|---|---|---|---|---|---|---|
| 1986 | 16,131 | 15,176 | 15,909 | 18,607 | 18,458 | 16,760 | 15,574 | 13,461 | 15,634 | 14,081 | 11,116 | 15,175 |
| 1987 | 18,423 | 13,905 | 16,652 | 14,833 | 18,384 | 17,171 | 15,453 | 16,249 | 14,412 | 14,972 | 17,658 | 18,906 |
| 1988 | 12,526 | 16,815 | 18,768 | 14,072 | 16,740 | 11,860 | 12,894 | 9,835 | 9,483 | 10,999 | 11,499 | 12,288 |
| 1989 | 11,096 | 9,249 | 7,074 | 4,701 | 11,315 | 8,522 | 11,380 | 7,498 | 5,956 | 9,234 | 8,356 | 8,532 |
| 1990 | 6,890 | 6,743 | 3,792 | 4,931 | 5,224 | 2,481 | 3,506 | 6,627 | 4,502 | 6,263 | 5,359 | 5,120 |
| 1991 | 6,092 | 9,192 | 6,724 | 2,417 | 2,842 | 3,872 | 3,708 | 4,369 | 3,598 | 6,231 | 5,323 | 9,230 |
| 1992 | 5,399 | 5,829 | 7,944 | 7,753 | 6,733 | 3,889 | 1,951 | 2,614 | 3,201 | 3,543 | 3,654 | 3,429 |
| 1993 | 3,262 | 4,123 | 2,178 | 2,043 | 714 | 1,547 | 2,244 | 2,542 | 1,891 | 2,018 | 1,874 | 2,239 |
| 1994 | 4,704 | 4,641 | 4,274 | 2,384 | 1,420 | 1,542 | 1,596 | 1,866 | 1,155 | 357 | 3,456 | 2,920 |
| 1995 | 2,224 | 3,425 | 3,804 | 1,493 | 1,848 | 818 | 1,594 | 670 | 0 | 120 | 1,224 | 2,661 |
| 1996 | 71 | 393 | 798 | 97 | 496 | 1,000 | 451 | 545 | 406 | 227 | 0 | 136 |
| 1997 | 117 | 0 | 117 | 0 | 145 | 0 | 253 | 382 | 0 | 170 | 106 | 0 |
| 1998 | 177 | 196 | 376 | 278 | 204 | 436 | 0 | 91 | 0 | 0 | 566 | 0 |
| 1999 | 319 | 0 | 128 | 85 | 0 | 111 | 0 | 105 | 0 | 60 | 0 | 125 |
| 2000 | 42 | 0 | 161 | 43 | 90 | 0 | 28 | 0 | 10 | 30 | 38 | 55 |
| 2001 | 0 | 0 | 65 | 0 | 260 | 0 | 43 | 0 | 0 | 0 | 33 | 58 |
| 2002 | 0 | 0 | 0 | 0 | 0 | 0 | 61 | 0 | 48 | 0 | 43 | 0 |
| 2003 | 133 | 225 | 25 | |||||||||
| 2004 | 61 | |||||||||||
| 2005 | 0 | 0 | 0 | 0 | 0 | 230 | 559 | 0 | 314 | 148 | 0 | 57 |
| 2006 | 59 | 0 | 171 | 0 | 140 | 1 | 149 | 0 | 41 | 0 | 0 | |
| 2007 | 0 | 0 | 382 | 0 | 250 | 325 | 0 | 459 | 0 | 0 | 449 | 256 |
| 2008 | 57 | 95 | 65 | 60 | 365 | 117 | 62 | 210 | 0 | 165 | 123 | |
| 2009 | 0 | 3 | 0 | 0 | 0 | 0 | 97 | 0 | 205 | 355 | 443 | 0 |
| 2010 | 219 | 35 | 249 | 219 | 0 | 167 | 243 | 0 | 474 | 105 | 0 | 203 |
| 2011 | 0 | 199 | 0 | 187 | 217 | 239 | 116 | 83 | 104 | 0 | 94 | 0 |
| 2012 | 76 | 0 | 48 | 10 | 0 | 10 | 215 | 70 | 0 | 20 | 0 | 24 |
| 2013 | 0 | 0 | 247 | 0 | 0 | 99 | 222 | 222 | 203 | 0 | 89 | |
| 2014 | 112 | 80 | 132 | 213 | 5 | 190 | 5 | 267 | 160 | 79 | ||
| 2015 | 0 | 142 | 10 | 182 | 226 | 219 | 25 | 6 | 279 | |||
| 2016 | 84 | 4 | 64 | 5 | 4 | 5 | 4 | 6 | 5 | 4 | 4 | 3 |
| 2017 | 0 | 0 | 121 | 0 | 90 | 0 | 152 | 0 | 111 | 0 | 90 | |
| 2018 | 0 | 80 | 0 | 0 | 95 | 0 | 92 | 0 | 92 | 0 | 0 | |
| 2019 | 0 | 0 | 42 | 0 | 95 | 0 | 96 | 88 | 0 | 0 | 161 | |
| 2020 | 0 | 0 | 0 | 129 | 318 | 175 | 0 | 0 | 0 | 0 | 0 | |
| 2021 | 96 | 96 | 0 | 130 | 0 | 0 | 0 | 164 | 90 | 0 | ||
| 2022 | 0 | 96 | 96 | 20 | 0 | 0 | 0 | 0 | 0 | 0 | 0 | |
| 2023 | 0 | 0 | 157 | 184 | 0 | 0 | 217 | 0 | 0 | 88 | 0 | 0 |
| 2024 | 0 | |||||||||||
| - = No Data Reported; -- = Not Applicable; NA = Not Available; W = Withheld to avoid disclosure of individual company data. |
| Release Date: 3/29/2024 |
| Next Release Date: 4/30/2024 |