|
Download Data (XLS File) |
|
||||||||
|
||||||||
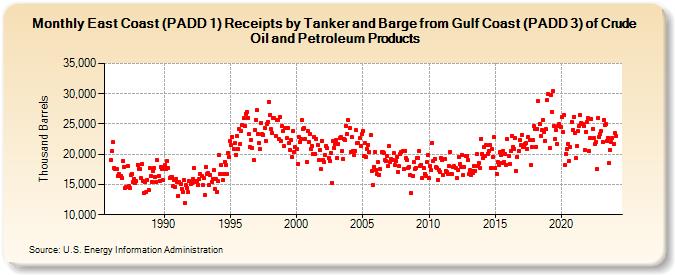
| East Coast (PADD 1) Receipts by Tanker and Barge from Gulf Coast (PADD 3) of Crude Oil and Petroleum Products (Thousand Barrels) | ||||||||
| Year | Jan | Feb | Mar | Apr | May | Jun | Jul | Aug | Sep | Oct | Nov | Dec |
|---|---|---|---|---|---|---|---|---|---|---|---|---|
| 1986 | 19,036 | 20,508 | 21,959 | 17,787 | 17,555 | 17,607 | 16,403 | 16,785 | 16,325 | 16,459 | 16,087 | 18,860 |
| 1987 | 17,953 | 14,413 | 14,599 | 18,020 | 14,779 | 14,370 | 16,535 | 16,763 | 15,358 | 15,921 | 15,268 | 15,507 |
| 1988 | 18,271 | 17,587 | 17,516 | 16,008 | 18,457 | 15,602 | 13,664 | 15,443 | 13,687 | 15,799 | 14,079 | 17,723 |
| 1989 | 16,462 | 15,474 | 17,277 | 17,743 | 16,280 | 15,458 | 19,039 | 16,469 | 15,616 | 17,848 | 17,574 | 15,681 |
| 1990 | 17,877 | 18,143 | 17,561 | 18,849 | 17,759 | 16,076 | 16,189 | 16,286 | 14,732 | 15,760 | 14,572 | 15,964 |
| 1991 | 15,490 | 13,143 | 15,485 | 14,998 | 14,313 | 13,705 | 15,728 | 11,974 | 14,836 | 14,467 | 13,686 | 15,504 |
| 1992 | 15,070 | 15,176 | 15,969 | 17,742 | 15,543 | 15,434 | 15,526 | 14,934 | 15,865 | 16,793 | 16,410 | 14,891 |
| 1993 | 16,006 | 13,301 | 17,926 | 16,715 | 16,883 | 14,928 | 16,556 | 15,455 | 15,957 | 17,319 | 14,320 | 15,841 |
| 1994 | 13,823 | 15,499 | 19,903 | 16,769 | 18,204 | 15,660 | 16,810 | 18,779 | 18,258 | 16,682 | 20,223 | 19,580 |
| 1995 | 22,149 | 21,444 | 22,907 | 20,878 | 21,838 | 19,929 | 23,046 | 20,865 | 24,139 | 21,676 | 23,767 | 24,791 |
| 1996 | 25,919 | 24,642 | 26,725 | 26,994 | 26,037 | 23,316 | 21,155 | 22,407 | 21,012 | 19,087 | 24,055 | 25,683 |
| 1997 | 27,233 | 23,323 | 21,836 | 20,791 | 25,202 | 23,374 | 23,237 | 24,316 | 22,248 | 25,023 | 25,375 | 28,684 |
| 1998 | 26,454 | 24,111 | 23,538 | 25,917 | 25,936 | 23,033 | 25,644 | 25,646 | 22,479 | 26,232 | 22,185 | 24,704 |
| 1999 | 23,778 | 21,364 | 24,259 | 22,631 | 24,392 | 21,811 | 20,775 | 22,277 | 19,504 | 23,851 | 20,421 | 21,203 |
| 2000 | 20,821 | 18,414 | 22,872 | 21,970 | 22,554 | 25,654 | 24,140 | 24,305 | 22,557 | 18,716 | 23,765 | 22,101 |
| 2001 | 23,339 | 20,863 | 21,417 | 20,055 | 22,898 | 20,043 | 22,532 | 21,511 | 18,999 | 20,716 | 17,499 | 22,266 |
| 2002 | 19,100 | 18,764 | 19,839 | 21,328 | 20,979 | 19,431 | 18,805 | 20,277 | 15,310 | 22,248 | 21,038 | 21,752 |
| 2003 | 22,403 | 19,443 | 21,718 | 22,612 | 22,829 | 20,538 | 19,190 | 22,564 | 22,280 | 24,723 | 23,405 | 25,597 |
| 2004 | 24,256 | 20,316 | 22,848 | 20,451 | 19,853 | 20,460 | 23,959 | 21,774 | 21,784 | 22,635 | 21,337 | 23,284 |
| 2005 | 23,895 | 19,683 | 21,826 | 19,536 | 20,844 | 21,599 | 20,376 | 23,120 | 17,181 | 14,931 | 17,966 | 20,367 |
| 2006 | 17,382 | 16,678 | 18,662 | 16,643 | 17,564 | 20,448 | 20,295 | 20,146 | 19,037 | 18,797 | 19,652 | 18,119 |
| 2007 | 21,319 | 18,731 | 19,257 | 19,038 | 20,142 | 18,193 | 18,862 | 19,495 | 17,124 | 17,988 | 20,037 | 20,402 |
| 2008 | 20,549 | 17,535 | 20,545 | 19,302 | 18,987 | 17,740 | 17,918 | 16,574 | 13,575 | 16,327 | 18,726 | 17,639 |
| 2009 | 17,787 | 19,313 | 19,328 | 20,472 | 18,086 | 18,271 | 16,141 | 17,749 | 16,780 | 16,475 | 18,658 | 19,869 |
| 2010 | 16,019 | 18,092 | 17,313 | 21,842 | 18,880 | 19,243 | 17,867 | 17,705 | 15,781 | 17,325 | 17,072 | 19,302 |
| 2011 | 19,058 | 16,645 | 19,223 | 17,287 | 17,079 | 16,713 | 18,097 | 20,428 | 16,680 | 16,700 | 17,848 | 18,004 |
| 2012 | 17,799 | 16,099 | 17,454 | 19,476 | 18,339 | 17,815 | 19,903 | 16,596 | 17,949 | 19,786 | 19,765 | 19,048 |
| 2013 | 16,663 | 17,311 | 16,585 | 17,209 | 16,879 | 18,132 | 17,244 | 19,966 | 18,038 | 18,593 | 17,737 | 22,588 |
| 2014 | 20,092 | 19,323 | 21,177 | 19,678 | 21,538 | 20,069 | 20,567 | 21,607 | 17,785 | 20,817 | 19,480 | 22,822 |
| 2015 | 17,668 | 16,731 | 18,694 | 18,195 | 20,312 | 19,890 | 18,618 | 20,539 | 18,723 | 20,065 | 18,272 | 22,467 |
| 2016 | 19,741 | 18,380 | 20,477 | 23,022 | 21,231 | 20,871 | 22,704 | 17,297 | 19,544 | 20,500 | 22,344 | 21,494 |
| 2017 | 23,221 | 21,262 | 21,280 | 21,755 | 21,809 | 20,882 | 22,872 | 22,334 | 18,249 | 21,182 | 22,290 | 24,629 |
| 2018 | 24,215 | 21,239 | 24,199 | 28,751 | 25,008 | 23,001 | 23,990 | 25,650 | 23,614 | 22,252 | 24,103 | 28,962 |
| 2019 | 29,923 | 21,069 | 29,719 | 27,033 | 30,369 | 24,678 | 22,531 | 23,984 | 21,758 | 24,686 | 24,958 | 24,488 |
| 2020 | 26,124 | 23,702 | 26,546 | 18,153 | 19,968 | 20,888 | 21,772 | 18,890 | 21,124 | 25,383 | 24,033 | 26,201 |
| 2021 | 23,430 | 19,323 | 21,326 | 23,786 | 24,654 | 26,517 | 25,243 | 25,065 | 24,614 | 20,660 | 23,716 | 25,373 |
| 2022 | 25,936 | 20,490 | 22,754 | 25,851 | 24,200 | 22,690 | 21,649 | 21,993 | 17,482 | 26,006 | 22,926 | 23,357 |
| 2023 | 23,826 | 22,038 | 25,658 | 24,857 | 24,960 | 22,251 | 22,700 | 18,504 | 20,768 | 22,001 | 22,681 | 21,634 |
| 2024 | 23,429 | |||||||||||
| - = No Data Reported; -- = Not Applicable; NA = Not Available; W = Withheld to avoid disclosure of individual company data. |
| Release Date: 3/29/2024 |
| Next Release Date: 4/30/2024 |