|
Download Data (XLS File) |
|
||||||||
|
||||||||
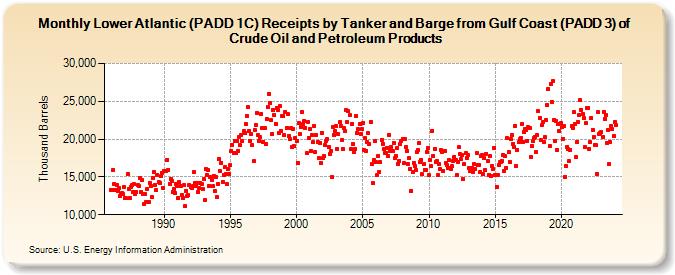
| Lower Atlantic (PADD 1C) Receipts by Tanker and Barge from Gulf Coast (PADD 3) of Crude Oil and Petroleum Products (Thousand Barrels) | ||||||||
| Year | Jan | Feb | Mar | Apr | May | Jun | Jul | Aug | Sep | Oct | Nov | Dec |
|---|---|---|---|---|---|---|---|---|---|---|---|---|
| 1986 | 13,330 | 13,258 | 15,931 | 14,098 | 13,328 | 13,955 | 13,178 | 13,563 | 12,480 | 12,799 | 12,854 | 12,705 |
| 1987 | 13,670 | 12,237 | 12,160 | 15,363 | 13,369 | 12,200 | 13,709 | 13,867 | 12,979 | 14,004 | 12,724 | 13,038 |
| 1988 | 13,914 | 13,812 | 14,827 | 13,024 | 14,622 | 12,799 | 11,353 | 12,715 | 11,737 | 13,382 | 11,710 | 14,213 |
| 1989 | 13,846 | 12,351 | 14,910 | 15,699 | 13,991 | 13,312 | 15,313 | 14,300 | 14,246 | 15,080 | 15,576 | 13,591 |
| 1990 | 15,762 | 15,789 | 15,793 | 17,274 | 15,976 | 14,117 | 14,781 | 14,465 | 12,956 | 13,337 | 12,862 | 14,115 |
| 1991 | 13,857 | 12,210 | 14,336 | 13,842 | 12,624 | 12,213 | 13,878 | 11,090 | 13,184 | 12,430 | 12,572 | 13,898 |
| 1992 | 13,650 | 13,568 | 13,785 | 15,594 | 14,166 | 13,734 | 14,154 | 13,014 | 13,515 | 14,145 | 14,064 | 13,414 |
| 1993 | 14,678 | 11,941 | 16,035 | 15,277 | 15,884 | 13,835 | 15,003 | 14,636 | 13,751 | 15,121 | 13,143 | 14,961 |
| 1994 | 12,369 | 14,118 | 17,348 | 15,741 | 16,859 | 14,347 | 15,313 | 16,253 | 15,400 | 14,001 | 16,028 | 15,383 |
| 1995 | 16,513 | 18,471 | 19,270 | 18,216 | 19,698 | 18,127 | 19,738 | 18,395 | 20,335 | 19,159 | 20,603 | 19,751 |
| 1996 | 21,033 | 20,837 | 21,987 | 23,087 | 24,189 | 21,095 | 19,783 | 20,716 | 19,219 | 17,049 | 21,227 | 21,833 |
| 1997 | 23,482 | 20,501 | 19,812 | 20,258 | 23,349 | 21,452 | 19,663 | 21,416 | 19,396 | 22,687 | 24,247 | 26,029 |
| 1998 | 24,793 | 22,469 | 20,728 | 23,830 | 23,189 | 22,018 | 24,121 | 23,801 | 20,826 | 24,368 | 21,046 | 23,077 |
| 1999 | 23,032 | 20,485 | 23,600 | 21,532 | 23,312 | 20,457 | 19,969 | 21,486 | 18,926 | 21,354 | 19,049 | 20,169 |
| 2000 | 19,766 | 16,879 | 22,100 | 20,727 | 21,610 | 23,588 | 22,015 | 22,402 | 21,522 | 18,102 | 22,304 | 20,169 |
| 2001 | 21,366 | 18,459 | 20,569 | 19,565 | 21,788 | 18,240 | 20,545 | 19,622 | 17,480 | 19,536 | 16,815 | 20,871 |
| 2002 | 17,540 | 17,815 | 19,226 | 19,781 | 19,983 | 19,008 | 18,053 | 18,436 | 14,981 | 21,666 | 20,511 | 21,029 |
| 2003 | 21,702 | 18,738 | 20,676 | 22,211 | 21,756 | 19,887 | 18,679 | 21,419 | 21,031 | 23,833 | 22,224 | 23,672 |
| 2004 | 23,127 | 18,658 | 22,057 | 19,342 | 18,350 | 18,713 | 23,033 | 20,851 | 21,298 | 21,966 | 20,704 | 21,292 |
| 2005 | 22,131 | 18,575 | 20,086 | 18,432 | 19,565 | 20,797 | 19,333 | 22,315 | 16,653 | 14,214 | 17,257 | 19,708 |
| 2006 | 16,911 | 15,225 | 17,748 | 15,710 | 16,907 | 19,896 | 19,410 | 18,727 | 18,214 | 18,180 | 18,876 | 17,790 |
| 2007 | 20,606 | 18,446 | 18,951 | 18,383 | 19,487 | 17,502 | 17,769 | 18,869 | 16,710 | 17,153 | 19,373 | 19,798 |
| 2008 | 20,040 | 16,775 | 19,995 | 18,972 | 18,478 | 16,766 | 17,504 | 16,083 | 13,139 | 15,616 | 16,839 | 16,457 |
| 2009 | 15,864 | 18,316 | 18,571 | 19,483 | 16,915 | 17,276 | 15,328 | 16,661 | 15,968 | 15,953 | 18,247 | 18,855 |
| 2010 | 15,202 | 17,238 | 16,402 | 21,129 | 17,797 | 18,748 | 17,005 | 17,111 | 15,209 | 16,715 | 16,005 | 18,551 |
| 2011 | 18,359 | 15,806 | 18,432 | 16,806 | 16,558 | 16,113 | 17,244 | 16,139 | 16,080 | 16,406 | 17,158 | 17,682 |
| 2012 | 17,256 | 15,208 | 17,003 | 18,918 | 17,986 | 17,327 | 17,841 | 14,696 | 16,717 | 18,110 | 17,543 | 17,955 |
| 2013 | 16,213 | 15,728 | 15,758 | 16,189 | 15,708 | 16,676 | 16,030 | 18,169 | 16,580 | 16,548 | 15,585 | 17,735 |
| 2014 | 17,922 | 15,332 | 17,451 | 15,921 | 18,068 | 17,137 | 15,284 | 17,763 | 15,185 | 16,470 | 16,094 | 18,832 |
| 2015 | 15,294 | 13,709 | 15,305 | 16,582 | 16,924 | 17,033 | 17,075 | 17,869 | 15,846 | 17,746 | 16,219 | 20,132 |
| 2016 | 18,249 | 17,022 | 19,975 | 20,530 | 19,383 | 18,929 | 21,768 | 16,424 | 18,609 | 19,570 | 19,951 | 20,210 |
| 2017 | 21,966 | 19,644 | 20,955 | 21,361 | 21,254 | 19,807 | 21,555 | 21,403 | 17,696 | 19,153 | 19,697 | 20,107 |
| 2018 | 20,335 | 18,265 | 20,522 | 23,671 | 22,794 | 19,830 | 21,835 | 22,259 | 19,654 | 20,237 | 22,535 | 24,521 |
| 2019 | 26,641 | 19,146 | 27,344 | 24,952 | 27,680 | 22,591 | 19,809 | 22,369 | 18,606 | 21,956 | 21,089 | 22,089 |
| 2020 | 21,578 | 20,062 | 21,777 | 15,007 | 16,398 | 18,977 | 18,657 | 17,064 | 18,609 | 21,709 | 21,444 | 23,550 |
| 2021 | 21,963 | 17,621 | 19,679 | 22,281 | 23,170 | 25,153 | 23,839 | 23,296 | 22,743 | 18,923 | 22,073 | 24,119 |
| 2022 | 24,077 | 18,702 | 19,642 | 22,759 | 21,267 | 20,267 | 19,209 | 19,159 | 15,380 | 23,583 | 20,678 | 20,814 |
| 2023 | 20,942 | 20,290 | 23,617 | 22,698 | 23,237 | 19,445 | 21,201 | 16,657 | 19,671 | 21,739 | 21,282 | 20,359 |
| 2024 | 22,280 | |||||||||||
| - = No Data Reported; -- = Not Applicable; NA = Not Available; W = Withheld to avoid disclosure of individual company data. |
| Release Date: 3/29/2024 |
| Next Release Date: 4/30/2024 |