|
Download Data (XLS File) |
|
||||||||
|
||||||||
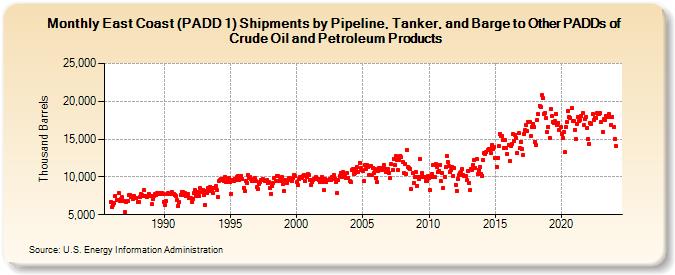
| East Coast (PADD 1) Shipments by Pipeline, Tanker, and Barge to Other PADDs of Crude Oil and Petroleum Products (Thousand Barrels) | ||||||||
| Year | Jan | Feb | Mar | Apr | May | Jun | Jul | Aug | Sep | Oct | Nov | Dec |
|---|---|---|---|---|---|---|---|---|---|---|---|---|
| 1986 | 6,660 | 6,014 | 6,346 | 6,579 | 7,482 | 6,958 | 6,955 | 7,889 | 6,806 | 7,070 | 7,295 | 6,750 |
| 1987 | 6,786 | 5,299 | 6,683 | 6,859 | 7,590 | 7,604 | 7,306 | 7,463 | 7,126 | 7,503 | 7,242 | 7,214 |
| 1988 | 6,681 | 6,645 | 7,321 | 7,717 | 7,565 | 7,486 | 8,238 | 7,502 | 7,505 | 7,292 | 7,749 | 7,443 |
| 1989 | 7,502 | 6,368 | 7,036 | 7,527 | 7,749 | 7,589 | 7,827 | 7,876 | 7,728 | 7,679 | 7,889 | 7,790 |
| 1990 | 6,740 | 6,306 | 6,788 | 7,765 | 7,901 | 7,755 | 7,704 | 8,044 | 7,686 | 7,785 | 7,652 | 7,463 |
| 1991 | 6,960 | 6,160 | 6,650 | 7,638 | 8,009 | 8,011 | 7,649 | 7,826 | 7,524 | 7,412 | 7,710 | 7,155 |
| 1992 | 7,203 | 6,708 | 7,092 | 7,839 | 8,316 | 7,440 | 7,445 | 8,052 | 7,492 | 8,511 | 7,990 | 8,292 |
| 1993 | 7,604 | 6,332 | 8,150 | 7,900 | 8,563 | 8,123 | 8,700 | 8,398 | 7,925 | 8,583 | 8,521 | 8,794 |
| 1994 | 8,234 | 7,332 | 9,489 | 9,550 | 9,789 | 9,660 | 9,524 | 10,053 | 9,347 | 9,309 | 9,601 | 9,873 |
| 1995 | 9,263 | 7,783 | 9,548 | 9,478 | 9,776 | 9,548 | 9,996 | 10,137 | 9,549 | 10,011 | 10,173 | 9,704 |
| 1996 | 8,554 | 8,122 | 9,515 | 9,206 | 10,198 | 9,842 | 9,942 | 9,657 | 9,415 | 9,581 | 9,848 | 9,393 |
| 1997 | 8,628 | 8,360 | 9,084 | 9,381 | 9,635 | 9,537 | 9,684 | 9,506 | 9,467 | 9,545 | 9,214 | 9,281 |
| 1998 | 8,554 | 7,782 | 8,831 | 9,199 | 9,796 | 9,489 | 10,055 | 10,090 | 9,471 | 9,602 | 9,502 | 9,949 |
| 1999 | 9,038 | 8,115 | 9,560 | 9,250 | 9,640 | 9,880 | 9,679 | 9,728 | 9,522 | 9,896 | 10,296 | 10,066 |
| 2000 | 9,310 | 8,897 | 9,725 | 10,038 | 9,958 | 9,835 | 10,105 | 10,228 | 9,511 | 9,956 | 10,338 | 10,229 |
| 2001 | 9,654 | 8,876 | 9,336 | 9,588 | 9,748 | 9,699 | 9,994 | 9,691 | 9,616 | 9,319 | 9,680 | 10,023 |
| 2002 | 9,318 | 8,209 | 9,729 | 9,331 | 9,650 | 9,601 | 9,725 | 9,544 | 10,006 | 9,952 | 10,188 | 9,789 |
| 2003 | 9,355 | 7,849 | 9,562 | 10,112 | 10,571 | 9,971 | 10,600 | 10,260 | 10,383 | 9,861 | 10,452 | 9,800 |
| 2004 | 9,494 | 9,262 | 10,907 | 11,011 | 10,444 | 10,461 | 11,011 | 11,287 | 10,713 | 11,866 | 11,163 | 10,863 |
| 2005 | 10,814 | 9,462 | 11,559 | 11,095 | 11,603 | 11,284 | 10,238 | 11,465 | 10,296 | 11,114 | 10,522 | 11,070 |
| 2006 | 9,909 | 9,318 | 10,796 | 11,184 | 11,178 | 10,862 | 11,145 | 11,603 | 11,043 | 10,661 | 11,051 | 10,985 |
| 2007 | 10,547 | 9,835 | 11,668 | 10,894 | 12,375 | 11,584 | 12,758 | 12,200 | 10,899 | 12,273 | 12,819 | 12,568 |
| 2008 | 12,028 | 10,453 | 11,755 | 10,450 | 13,620 | 11,315 | 11,195 | 11,091 | 8,336 | 10,493 | 9,212 | 9,987 |
| 2009 | 10,645 | 8,833 | 10,032 | 9,681 | 12,395 | 9,994 | 10,491 | 9,985 | 10,000 | 9,496 | 9,516 | 10,071 |
| 2010 | 9,894 | 8,208 | 10,007 | 10,387 | 11,609 | 9,922 | 11,686 | 11,344 | 10,610 | 10,796 | 11,601 | 9,434 |
| 2011 | 10,489 | 8,586 | 10,034 | 11,316 | 12,718 | 11,949 | 11,377 | 10,611 | 10,872 | 11,299 | 10,127 | 11,157 |
| 2012 | 8,963 | 8,150 | 9,668 | 10,289 | 10,502 | 10,626 | 10,997 | 10,259 | 10,093 | 10,124 | 9,525 | 10,734 |
| 2013 | 9,173 | 8,256 | 11,066 | 10,929 | 11,632 | 12,196 | 11,160 | 12,363 | 10,381 | 10,967 | 11,307 | 10,436 |
| 2014 | 10,174 | 12,244 | 13,137 | 13,067 | 13,242 | 13,596 | 13,693 | 13,649 | 13,126 | 14,222 | 13,675 | 13,958 |
| 2015 | 12,484 | 11,361 | 12,548 | 14,025 | 15,678 | 15,408 | 15,452 | 14,930 | 13,871 | 14,828 | 13,761 | 13,039 |
| 2016 | 14,232 | 12,087 | 14,094 | 14,406 | 15,668 | 14,761 | 15,571 | 15,175 | 13,165 | 15,772 | 13,778 | 14,632 |
| 2017 | 13,726 | 12,934 | 15,708 | 16,194 | 16,904 | 16,049 | 17,248 | 17,292 | 15,376 | 16,585 | 17,033 | 16,664 |
| 2018 | 14,652 | 14,177 | 17,568 | 18,318 | 19,431 | 19,224 | 20,768 | 20,378 | 18,346 | 18,453 | 17,786 | 15,915 |
| 2019 | 16,633 | 15,185 | 18,970 | 18,062 | 17,261 | 17,129 | 17,355 | 18,327 | 16,897 | 17,172 | 16,163 | 16,551 |
| 2020 | 15,709 | 15,134 | 15,932 | 13,240 | 16,576 | 17,312 | 18,745 | 17,934 | 17,834 | 19,064 | 17,387 | 17,378 |
| 2021 | 16,263 | 14,956 | 17,013 | 17,922 | 17,354 | 17,587 | 18,119 | 18,429 | 16,822 | 17,593 | 17,959 | 16,505 |
| 2022 | 15,026 | 14,355 | 17,089 | 17,003 | 18,253 | 17,533 | 17,846 | 17,752 | 18,398 | 18,265 | 18,377 | 18,395 |
| 2023 | 17,277 | 15,943 | 17,616 | 17,561 | 18,093 | 17,981 | 17,861 | 18,285 | 17,919 | 16,917 | 17,934 | 16,596 |
| 2024 | 14,955 | |||||||||||
| - = No Data Reported; -- = Not Applicable; NA = Not Available; W = Withheld to avoid disclosure of individual company data. |
| Release Date: 3/29/2024 |
| Next Release Date: 4/30/2024 |
Referring Pages: