|
Download Data (XLS File) |
|
||||||||
|
||||||||
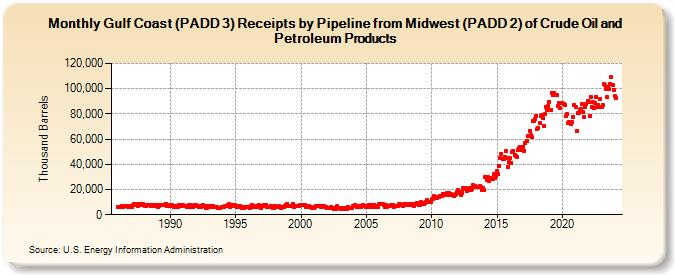
| Gulf Coast (PADD 3) Receipts by Pipeline from Midwest (PADD 2) of Crude Oil and Petroleum Products (Thousand Barrels) | ||||||||
| Year | Jan | Feb | Mar | Apr | May | Jun | Jul | Aug | Sep | Oct | Nov | Dec |
|---|---|---|---|---|---|---|---|---|---|---|---|---|
| 1986 | 5,989 | 5,930 | 6,183 | 6,342 | 6,967 | 6,180 | 6,538 | 6,980 | 6,663 | 6,461 | 6,935 | 7,183 |
| 1987 | 6,981 | 6,358 | 8,065 | 8,563 | 8,418 | 8,025 | 7,230 | 8,760 | 7,895 | 8,139 | 7,630 | 8,665 |
| 1988 | 7,894 | 6,725 | 6,761 | 7,710 | 7,926 | 7,849 | 6,984 | 7,414 | 7,376 | 7,536 | 6,729 | 8,076 |
| 1989 | 7,911 | 6,155 | 7,207 | 7,929 | 7,775 | 7,688 | 7,783 | 7,568 | 8,803 | 6,962 | 7,065 | 6,751 |
| 1990 | 8,081 | 6,795 | 7,452 | 6,513 | 7,152 | 6,248 | 6,666 | 6,305 | 7,344 | 7,329 | 7,309 | 7,387 |
| 1991 | 7,540 | 6,988 | 6,553 | 6,231 | 6,716 | 7,386 | 5,761 | 7,524 | 6,542 | 5,935 | 7,219 | 7,523 |
| 1992 | 7,537 | 6,893 | 6,486 | 7,171 | 6,257 | 7,120 | 7,403 | 6,818 | 6,884 | 5,321 | 5,426 | 6,651 |
| 1993 | 7,311 | 5,956 | 6,783 | 6,587 | 6,112 | 6,260 | 5,857 | 5,815 | 5,355 | 5,547 | 5,441 | 5,794 |
| 1994 | 6,007 | 5,771 | 7,091 | 6,795 | 7,107 | 7,765 | 8,393 | 6,230 | 7,052 | 7,958 | 7,240 | 7,431 |
| 1995 | 7,250 | 6,125 | 6,475 | 6,733 | 7,094 | 6,262 | 5,576 | 6,127 | 5,662 | 6,033 | 6,000 | 6,149 |
| 1996 | 5,881 | 5,240 | 6,783 | 7,811 | 6,125 | 6,134 | 6,601 | 6,300 | 7,051 | 7,552 | 6,222 | 5,355 |
| 1997 | 6,840 | 6,776 | 7,804 | 7,584 | 7,575 | 6,136 | 5,771 | 5,896 | 7,199 | 5,727 | 5,434 | 5,589 |
| 1998 | 6,743 | 5,813 | 6,487 | 6,179 | 6,949 | 6,501 | 5,673 | 6,450 | 6,069 | 6,997 | 7,568 | 8,496 |
| 1999 | 6,989 | 6,562 | 6,577 | 6,745 | 7,303 | 8,138 | 5,985 | 6,690 | 7,232 | 6,911 | 7,172 | 7,793 |
| 2000 | 7,950 | 7,802 | 7,624 | 7,855 | 7,889 | 6,213 | 6,065 | 6,536 | 5,906 | 5,986 | 5,277 | 5,243 |
| 2001 | 5,201 | 5,971 | 6,662 | 6,715 | 6,844 | 7,117 | 6,177 | 6,597 | 7,091 | 6,911 | 6,508 | 6,118 |
| 2002 | 5,268 | 5,171 | 5,558 | 5,215 | 5,946 | 5,385 | 4,191 | 5,388 | 4,726 | 6,640 | 5,342 | 5,048 |
| 2003 | 5,684 | 4,418 | 5,403 | 5,228 | 4,394 | 5,263 | 4,543 | 5,830 | 5,641 | 5,546 | 5,209 | 5,381 |
| 2004 | 6,800 | 6,529 | 7,900 | 6,391 | 6,463 | 7,060 | 6,345 | 6,108 | 6,935 | 7,830 | 7,185 | 6,882 |
| 2005 | 6,450 | 5,793 | 7,652 | 6,669 | 7,358 | 6,322 | 8,028 | 7,670 | 6,484 | 6,625 | 6,677 | 6,135 |
| 2006 | 8,837 | 8,264 | 8,700 | 8,166 | 8,017 | 6,499 | 7,551 | 6,504 | 6,617 | 6,877 | 6,957 | 7,314 |
| 2007 | 7,405 | 6,250 | 6,943 | 6,562 | 6,761 | 7,032 | 8,552 | 8,494 | 7,374 | 7,491 | 7,079 | 8,160 |
| 2008 | 8,805 | 7,470 | 8,428 | 7,621 | 8,649 | 8,250 | 8,368 | 7,936 | 7,140 | 8,845 | 9,153 | 8,157 |
| 2009 | 7,520 | 7,869 | 9,758 | 8,820 | 8,906 | 8,808 | 9,183 | 10,116 | 11,345 | 10,361 | 9,893 | 9,979 |
| 2010 | 12,430 | 12,712 | 14,496 | 13,744 | 14,098 | 13,451 | 13,775 | 14,093 | 14,693 | 14,922 | 16,669 | 15,959 |
| 2011 | 16,338 | 15,587 | 16,991 | 15,433 | 17,028 | 16,347 | 16,584 | 15,449 | 15,023 | 15,285 | 16,672 | 17,899 |
| 2012 | 19,294 | 17,057 | 17,732 | 15,962 | 17,575 | 21,076 | 20,300 | 20,922 | 18,843 | 19,664 | 20,596 | 20,894 |
| 2013 | 19,577 | 20,080 | 23,452 | 22,039 | 22,418 | 22,055 | 22,058 | 22,180 | 22,803 | 21,597 | 19,329 | 20,809 |
| 2014 | 19,847 | 29,546 | 29,825 | 27,469 | 29,709 | 26,771 | 29,170 | 28,246 | 28,228 | 32,285 | 29,010 | 30,851 |
| 2015 | 34,493 | 31,951 | 38,973 | 44,633 | 48,284 | 44,135 | 44,030 | 45,848 | 50,628 | 45,296 | 37,645 | 41,626 |
| 2016 | 44,710 | 41,410 | 49,936 | 50,567 | 47,640 | 46,398 | 45,538 | 51,208 | 52,673 | 53,622 | 51,564 | 51,226 |
| 2017 | 53,997 | 50,377 | 56,883 | 58,522 | 62,296 | 62,630 | 66,792 | 63,083 | 61,293 | 74,321 | 74,173 | 76,260 |
| 2018 | 78,484 | 68,261 | 69,170 | 72,537 | 77,949 | 78,911 | 76,450 | 70,469 | 80,081 | 85,688 | 83,459 | 86,365 |
| 2019 | 89,500 | 82,820 | 96,926 | 94,775 | 96,331 | 94,628 | 95,075 | 95,161 | 86,219 | 88,622 | 84,943 | 88,926 |
| 2020 | 88,991 | 87,454 | 86,922 | 77,982 | 79,787 | 72,834 | 73,883 | 73,930 | 71,705 | 73,174 | 77,706 | 86,853 |
| 2021 | 85,206 | 66,580 | 80,520 | 80,767 | 83,394 | 84,202 | 87,523 | 81,565 | 77,587 | 85,806 | 87,809 | 90,286 |
| 2022 | 89,658 | 78,325 | 93,419 | 85,336 | 89,576 | 84,969 | 88,270 | 93,471 | 85,443 | 87,176 | 92,123 | 85,641 |
| 2023 | 85,564 | 87,293 | 103,505 | 102,541 | 100,054 | 93,120 | 101,645 | 99,626 | 103,581 | 109,007 | 102,875 | 99,257 |
| 2024 | 94,153 | |||||||||||
| - = No Data Reported; -- = Not Applicable; NA = Not Available; W = Withheld to avoid disclosure of individual company data. |
| Release Date: 3/29/2024 |
| Next Release Date: 4/30/2024 |