|
Download Data (XLS File) |
|
||||||||
|
||||||||
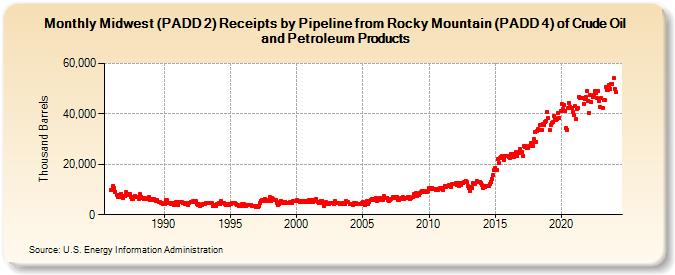
| Midwest (PADD 2) Receipts by Pipeline from Rocky Mountain (PADD 4) of Crude Oil and Petroleum Products (Thousand Barrels) | ||||||||
| Year | Jan | Feb | Mar | Apr | May | Jun | Jul | Aug | Sep | Oct | Nov | Dec |
|---|---|---|---|---|---|---|---|---|---|---|---|---|
| 1986 | 9,898 | 9,629 | 11,355 | 10,595 | 9,176 | 8,008 | 7,095 | 7,647 | 7,356 | 8,372 | 7,064 | 6,542 |
| 1987 | 7,562 | 7,495 | 8,943 | 7,893 | 8,398 | 8,327 | 6,959 | 6,199 | 6,133 | 6,927 | 7,591 | 7,134 |
| 1988 | 7,002 | 6,384 | 8,086 | 7,172 | 6,659 | 6,822 | 6,220 | 6,504 | 6,042 | 6,039 | 7,014 | 6,019 |
| 1989 | 6,188 | 5,726 | 6,130 | 6,249 | 5,909 | 5,370 | 5,796 | 5,005 | 5,011 | 4,586 | 4,472 | 4,200 |
| 1990 | 4,449 | 4,357 | 5,718 | 5,729 | 4,791 | 4,644 | 4,100 | 4,781 | 4,342 | 3,711 | 4,572 | 5,000 |
| 1991 | 5,192 | 3,917 | 5,041 | 5,114 | 5,022 | 4,816 | 4,624 | 4,382 | 4,466 | 4,191 | 3,973 | 4,475 |
| 1992 | 4,976 | 5,002 | 5,309 | 5,010 | 5,219 | 5,315 | 4,391 | 3,978 | 4,184 | 3,287 | 3,951 | 4,235 |
| 1993 | 4,405 | 4,070 | 4,807 | 4,450 | 4,584 | 4,708 | 4,570 | 4,678 | 3,409 | 3,816 | 3,709 | 3,633 |
| 1994 | 4,228 | 4,120 | 4,764 | 4,334 | 5,247 | 4,689 | 4,763 | 4,393 | 4,009 | 3,816 | 4,182 | 3,898 |
| 1995 | 4,431 | 4,143 | 4,681 | 4,587 | 4,540 | 4,195 | 3,923 | 3,822 | 3,602 | 3,268 | 3,608 | 4,074 |
| 1996 | 4,165 | 3,515 | 3,366 | 3,715 | 3,742 | 3,775 | 3,881 | 3,822 | 3,319 | 3,380 | 3,426 | 3,120 |
| 1997 | 3,416 | 3,025 | 3,525 | 4,453 | 5,499 | 5,875 | 5,464 | 6,239 | 5,830 | 5,538 | 5,723 | 5,949 |
| 1998 | 6,896 | 5,471 | 6,493 | 6,167 | 5,903 | 5,645 | 4,650 | 3,721 | 4,273 | 5,027 | 5,560 | 5,138 |
| 1999 | 4,768 | 4,551 | 5,231 | 4,583 | 4,682 | 4,796 | 5,071 | 4,755 | 4,732 | 5,353 | 5,258 | 5,476 |
| 2000 | 5,906 | 5,378 | 5,386 | 5,094 | 5,320 | 5,090 | 5,255 | 5,420 | 5,159 | 5,566 | 5,154 | 5,665 |
| 2001 | 5,169 | 5,254 | 5,861 | 5,118 | 5,719 | 5,518 | 6,170 | 5,159 | 4,732 | 5,160 | 5,583 | 5,549 |
| 2002 | 4,633 | 3,598 | 4,837 | 4,932 | 4,358 | 4,415 | 4,697 | 4,704 | 4,623 | 4,610 | 4,375 | 5,434 |
| 2003 | 4,830 | 4,481 | 4,605 | 4,121 | 4,349 | 4,618 | 4,279 | 4,714 | 4,391 | 5,345 | 4,937 | 4,928 |
| 2004 | 4,416 | 4,197 | 4,136 | 3,767 | 4,634 | 4,227 | 4,632 | 4,059 | 4,245 | 4,092 | 4,186 | 4,688 |
| 2005 | 4,997 | 4,697 | 3,735 | 4,660 | 5,536 | 4,160 | 5,152 | 5,822 | 6,068 | 5,853 | 6,056 | 5,917 |
| 2006 | 6,624 | 5,505 | 5,906 | 5,989 | 6,635 | 6,281 | 5,971 | 7,553 | 6,720 | 6,545 | 6,722 | 5,842 |
| 2007 | 5,540 | 5,859 | 6,401 | 6,885 | 7,109 | 6,706 | 6,851 | 7,202 | 5,909 | 6,013 | 6,397 | 6,662 |
| 2008 | 6,836 | 6,245 | 6,522 | 6,624 | 6,793 | 6,917 | 6,907 | 6,342 | 6,721 | 6,867 | 8,265 | 8,301 |
| 2009 | 8,791 | 7,474 | 8,233 | 7,904 | 8,430 | 9,192 | 9,547 | 9,507 | 8,822 | 9,143 | 9,058 | 9,493 |
| 2010 | 10,573 | 10,152 | 10,014 | 10,698 | 10,171 | 10,260 | 9,807 | 10,328 | 9,779 | 10,342 | 10,433 | 10,451 |
| 2011 | 10,507 | 9,684 | 11,334 | 10,814 | 11,431 | 11,275 | 11,873 | 11,930 | 10,826 | 12,209 | 12,165 | 11,999 |
| 2012 | 12,488 | 11,848 | 12,735 | 11,317 | 12,413 | 11,688 | 12,462 | 12,411 | 12,837 | 13,459 | 12,829 | 11,578 |
| 2013 | 10,776 | 9,511 | 11,081 | 10,779 | 12,434 | 12,026 | 12,199 | 13,285 | 12,923 | 13,058 | 13,072 | 12,507 |
| 2014 | 11,680 | 10,454 | 11,525 | 11,147 | 11,532 | 11,333 | 11,453 | 12,070 | 13,153 | 14,115 | 15,709 | 17,637 |
| 2015 | 18,681 | 17,764 | 21,985 | 20,578 | 22,303 | 22,997 | 23,468 | 22,624 | 21,820 | 23,437 | 23,465 | 23,442 |
| 2016 | 23,044 | 22,639 | 24,250 | 23,971 | 24,029 | 22,817 | 23,375 | 24,933 | 23,389 | 24,517 | 25,905 | 24,821 |
| 2017 | 24,795 | 23,434 | 27,147 | 26,756 | 27,234 | 26,446 | 26,597 | 27,360 | 28,512 | 28,413 | 27,154 | 29,941 |
| 2018 | 32,653 | 28,879 | 33,235 | 33,861 | 35,632 | 33,591 | 33,792 | 35,851 | 35,778 | 36,817 | 37,034 | 40,866 |
| 2019 | 38,463 | 33,525 | 35,689 | 36,487 | 36,737 | 39,207 | 38,332 | 37,755 | 38,009 | 40,370 | 38,315 | 40,992 |
| 2020 | 43,975 | 41,973 | 43,539 | 41,186 | 34,430 | 33,613 | 42,429 | 44,440 | 42,881 | 42,164 | 40,703 | 39,598 |
| 2021 | 42,987 | 37,841 | 41,756 | 42,466 | 46,842 | 46,473 | 46,127 | 46,111 | 44,030 | 46,061 | 46,811 | 48,990 |
| 2022 | 45,284 | 40,478 | 47,344 | 44,789 | 46,614 | 47,534 | 48,980 | 48,235 | 46,127 | 49,157 | 45,310 | 42,601 |
| 2023 | 46,211 | 42,473 | 45,334 | 45,522 | 50,478 | 49,358 | 49,615 | 51,440 | 49,924 | 52,056 | 51,883 | 54,098 |
| 2024 | 49,853 | 48,670 | 53,562 | 52,119 | 54,391 | 51,737 | ||||||
| - = No Data Reported; -- = Not Applicable; NA = Not Available; W = Withheld to avoid disclosure of individual company data. |
| Release Date: 8/30/2024 |
| Next Release Date: 9/30/2024 |