|
Download Data (XLS File) |
|
||||||||
|
||||||||
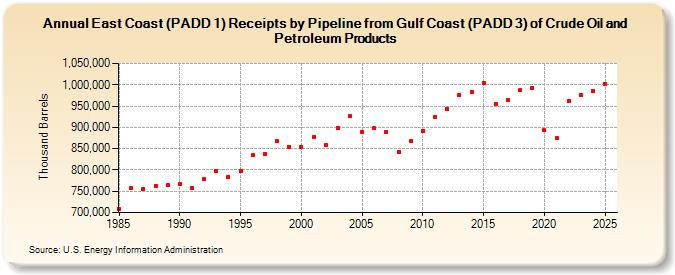
| East Coast (PADD 1) Receipts by Pipeline from Gulf Coast (PADD 3) of Crude Oil and Petroleum Products (Thousand Barrels) | ||||||||
| Decade | Year-0 | Year-1 | Year-2 | Year-3 | Year-4 | Year-5 | Year-6 | Year-7 | Year-8 | Year-9 |
|---|---|---|---|---|---|---|---|---|---|---|
| 1980's | 708,478 | 756,853 | 755,574 | 762,281 | 764,105 | |||||
| 1990's | 767,087 | 757,383 | 778,663 | 797,440 | 783,918 | 796,751 | 835,094 | 838,012 | 867,464 | 854,377 |
| 2000's | 854,777 | 877,094 | 857,497 | 899,578 | 926,952 | 890,196 | 897,898 | 889,483 | 841,574 | 868,471 |
| 2010's | 892,439 | 924,532 | 943,762 | 975,381 | 984,076 | 1,005,048 | 955,876 | 963,861 | 988,142 | 992,872 |
| 2020's | 893,204 | 874,192 | 961,756 | 976,570 |
| - = No Data Reported; -- = Not Applicable; NA = Not Available; W = Withheld to avoid disclosure of individual company data. |
| Release Date: 3/29/2024 |
| Next Release Date: 8/30/2024 |