|
Download Data (XLS File) |
|
||||||||
|
||||||||
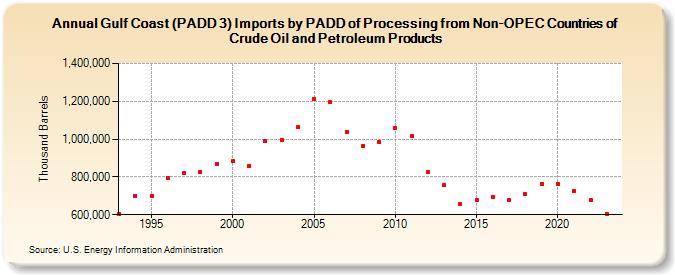
| Gulf Coast (PADD 3) Imports by PADD of Processing from Non-OPEC Countries of Crude Oil and Petroleum Products (Thousand Barrels) | ||||||||
| Decade | Year-0 | Year-1 | Year-2 | Year-3 | Year-4 | Year-5 | Year-6 | Year-7 | Year-8 | Year-9 |
|---|---|---|---|---|---|---|---|---|---|---|
| 1990's | 604,800 | 701,249 | 700,770 | 796,154 | 819,154 | 825,993 | 867,199 | |||
| 2000's | 882,566 | 858,620 | 992,178 | 996,236 | 1,063,776 | 1,212,513 | 1,194,053 | 1,038,822 | 965,535 | 984,227 |
| 2010's | 1,059,273 | 1,015,383 | 825,857 | 757,844 | 654,636 | 679,185 | 695,890 | 679,523 | 708,084 | 764,725 |
| 2020's | 764,334 | 723,700 | 677,393 | 605,154 |
| - = No Data Reported; -- = Not Applicable; NA = Not Available; W = Withheld to avoid disclosure of individual company data. |
| Release Date: 3/29/2024 |
| Next Release Date: 8/30/2024 |