|
Download Data (XLS File) |
|
||||||||
|
||||||||
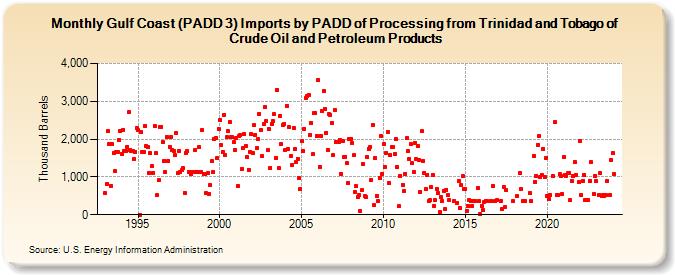
| Gulf Coast (PADD 3) Imports by PADD of Processing from Trinidad and Tobago of Crude Oil and Petroleum Products (Thousand Barrels) | ||||||||
| Year | Jan | Feb | Mar | Apr | May | Jun | Jul | Aug | Sep | Oct | Nov | Dec |
|---|---|---|---|---|---|---|---|---|---|---|---|---|
| 1993 | 574 | 802 | 2,213 | 1,879 | 770 | 1,865 | 1,632 | 1,153 | 1,659 | 1,670 | 1,986 | 2,214 |
| 1994 | 1,614 | 2,250 | 1,679 | 1,680 | 1,796 | 2,707 | 1,712 | 1,691 | 1,678 | 1,468 | 1,658 | 2,300 |
| 1995 | 2,235 | 0 | 2,185 | 1,662 | 1,653 | 2,347 | 1,810 | 1,783 | 1,112 | 1,620 | 1,281 | 1,110 |
| 1996 | 2,340 | 1,620 | 517 | 910 | 2,321 | 2,332 | 1,921 | 1,431 | 1,123 | 2,065 | 1,433 | 1,803 |
| 1997 | 2,062 | 1,710 | 1,698 | 1,579 | 2,170 | 1,095 | 1,686 | 1,142 | 1,180 | 1,227 | 584 | 1,642 |
| 1998 | 1,681 | 1,137 | 1,123 | 1,067 | 1,137 | 1,136 | 1,721 | 1,129 | 1,135 | 1,781 | 1,139 | 2,239 |
| 1999 | 1,068 | 1,073 | 564 | 1,101 | 551 | 784 | 1,409 | 1,118 | 2,000 | 2,042 | 1,504 | 2,269 |
| 2000 | 2,517 | 1,840 | 1,667 | 2,640 | 1,570 | 2,047 | 2,201 | 2,465 | 2,048 | 2,049 | 1,916 | 1,715 |
| 2001 | 2,030 | 769 | 2,079 | 2,110 | 1,220 | 1,766 | 2,129 | 1,828 | 1,518 | 1,195 | 1,666 | 2,138 |
| 2002 | 1,639 | 2,360 | 2,115 | 1,760 | 1,990 | 2,672 | 2,238 | 1,545 | 2,392 | 2,840 | 2,466 | 1,703 |
| 2003 | 2,261 | 1,245 | 2,405 | 2,471 | 2,657 | 1,512 | 3,306 | 1,230 | 2,623 | 1,864 | 2,361 | 2,402 |
| 2004 | 1,713 | 2,882 | 1,738 | 2,307 | 1,561 | 1,328 | 2,304 | 1,736 | 1,402 | 1,486 | 969 | 692 |
| 2005 | 1,947 | 1,690 | 2,278 | 3,091 | 3,147 | 3,175 | 2,118 | 2,421 | 1,598 | 2,683 | 2,687 | 2,089 |
| 2006 | 3,568 | 1,264 | 2,092 | 2,752 | 3,277 | 2,803 | 2,171 | 1,714 | 2,662 | 2,642 | 2,437 | 1,569 |
| 2007 | 2,775 | 1,927 | 1,933 | 1,924 | 1,984 | 1,082 | 1,958 | 1,521 | 1,534 | 1,365 | 835 | 2,006 |
| 2008 | 2,012 | 1,895 | 1,570 | 610 | 747 | 472 | 510 | 87 | 644 | 1,338 | 498 | 462 |
| 2009 | 1,532 | 1,745 | 1,782 | 916 | 2,377 | 250 | 1,499 | 501 | 360 | 975 | 2,093 | 1,081 |
| 2010 | 1,867 | 1,259 | 1,627 | 2,181 | 839 | 1,567 | 1,803 | 1,796 | 1,602 | 2,007 | 1,256 | 223 |
| 2011 | 1,035 | 784 | 619 | 1,077 | 2,027 | 1,674 | 1,470 | 1,868 | 1,359 | 1,138 | 1,908 | |
| 2012 | 1,470 | 1,818 | 1,459 | 608 | 2,201 | 1,432 | 1,100 | 680 | 1,057 | 351 | 380 | 739 |
| 2013 | 1,057 | 241 | 380 | 674 | 563 | 64 | 460 | 374 | 639 | 151 | 665 | 517 |
| 2014 | 381 | 361 | 322 | 895 | 175 | 784 | 1,016 | 672 | ||||
| 2015 | 681 | 95 | 232 | 376 | 360 | 240 | 361 | 360 | 709 | 353 | 6 | |
| 2016 | 240 | 120 | 349 | 365 | 360 | 360 | 759 | 361 | 380 | |||
| 2017 | 362 | 147 | 738 | 201 | 645 | 350 | ||||||
| 2018 | 499 | 1,092 | 668 | 360 | 360 | 576 | ||||||
| 2019 | 360 | 1,558 | 875 | 1,021 | 1,845 | 2,095 | 998 | 1,050 | 1,750 | 995 | 1,505 | |
| 2020 | 498 | 421 | 525 | 1,025 | 2,445 | 526 | 523 | 1,065 | 1,037 | 546 | ||
| 2021 | 1,527 | 1,063 | 1,029 | 1,091 | 1,099 | 379 | 898 | 1,021 | 1,393 | 1,060 | 861 | |
| 2022 | 1,949 | 525 | 900 | 1,059 | 379 | 391 | 903 | 1,387 | 549 | 1,034 | ||
| 2023 | 891 | 525 | 1,096 | 500 | 525 | 508 | 524 | 900 | 523 | 1,451 | ||
| 2024 | 1,624 | |||||||||||
| - = No Data Reported; -- = Not Applicable; NA = Not Available; W = Withheld to avoid disclosure of individual company data. |
| Release Date: 3/29/2024 |
| Next Release Date: 4/30/2024 |