|
Download Data (XLS File) |
|
||||||||
|
||||||||
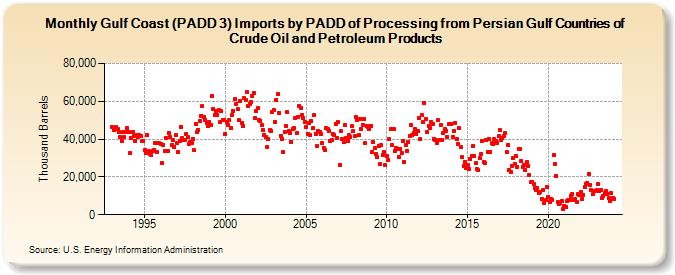
| Gulf Coast (PADD 3) Imports by PADD of Processing from Persian Gulf Countries of Crude Oil and Petroleum Products (Thousand Barrels) | ||||||||
| Year | Jan | Feb | Mar | Apr | May | Jun | Jul | Aug | Sep | Oct | Nov | Dec |
|---|---|---|---|---|---|---|---|---|---|---|---|---|
| 1993 | 46,175 | 44,983 | 46,072 | 46,377 | 45,082 | 43,601 | 41,293 | 39,147 | 43,798 | 41,273 | 43,530 | 45,940 |
| 1994 | 43,849 | 32,443 | 40,648 | 43,826 | 41,755 | 39,190 | 42,094 | 41,274 | 42,179 | 41,575 | 38,837 | 39,002 |
| 1995 | 34,067 | 32,386 | 42,075 | 33,449 | 32,325 | 31,589 | 33,796 | 34,367 | 37,911 | 33,019 | 37,764 | 37,735 |
| 1996 | 37,641 | 27,106 | 37,126 | 33,741 | 40,584 | 33,648 | 43,490 | 41,256 | 36,811 | 39,341 | 36,019 | 42,058 |
| 1997 | 38,060 | 33,154 | 39,089 | 46,628 | 40,388 | 39,568 | 39,776 | 42,693 | 41,030 | 37,600 | 38,708 | 38,198 |
| 1998 | 40,228 | 34,018 | 47,740 | 43,660 | 44,938 | 49,722 | 52,352 | 57,280 | 51,749 | 50,349 | 48,678 | 47,152 |
| 1999 | 49,101 | 47,406 | 62,779 | 56,119 | 52,898 | 54,945 | 52,797 | 55,256 | 48,888 | 54,682 | 50,055 | 50,230 |
| 2000 | 42,574 | 48,941 | 47,533 | 50,185 | 45,886 | 52,686 | 55,060 | 60,992 | 58,755 | 55,959 | 49,929 | 60,006 |
| 2001 | 48,533 | 46,892 | 61,589 | 60,475 | 64,946 | 57,751 | 58,705 | 59,885 | 62,879 | 64,511 | 51,138 | 55,056 |
| 2002 | 56,202 | 50,013 | 49,837 | 47,324 | 44,989 | 42,216 | 41,224 | 35,773 | 40,015 | 45,032 | 44,090 | 54,591 |
| 2003 | 55,639 | 49,010 | 60,929 | 63,996 | 54,041 | 41,826 | 40,273 | 32,919 | 43,588 | 47,148 | 54,206 | 44,086 |
| 2004 | 43,468 | 38,630 | 45,473 | 46,100 | 51,056 | 43,048 | 51,741 | 57,600 | 56,705 | 52,915 | 51,244 | 49,105 |
| 2005 | 46,346 | 42,886 | 48,578 | 42,273 | 49,408 | 45,775 | 52,566 | 42,856 | 36,201 | 44,290 | 43,986 | 42,740 |
| 2006 | 37,827 | 35,503 | 34,132 | 45,621 | 45,298 | 44,512 | 39,099 | 39,632 | 42,872 | 41,952 | 48,248 | 40,421 |
| 2007 | 48,852 | 26,198 | 44,051 | 39,928 | 38,257 | 47,343 | 40,831 | 39,124 | 41,995 | 41,285 | 46,774 | 44,044 |
| 2008 | 41,487 | 51,759 | 50,163 | 41,970 | 50,554 | 45,213 | 47,722 | 50,714 | 37,784 | 46,998 | 46,180 | 45,464 |
| 2009 | 47,172 | 33,015 | 38,358 | 35,274 | 31,878 | 30,574 | 36,469 | 26,878 | 36,739 | 31,759 | 33,378 | 26,162 |
| 2010 | 31,300 | 29,005 | 39,852 | 45,301 | 36,819 | 45,145 | 33,736 | 35,254 | 35,019 | 30,512 | 35,015 | 32,833 |
| 2011 | 38,731 | 28,115 | 36,710 | 33,905 | 38,631 | 41,472 | 47,697 | 41,986 | 43,261 | 45,092 | 42,555 | 44,525 |
| 2012 | 51,211 | 39,981 | 52,561 | 49,285 | 58,918 | 50,507 | 43,578 | 47,006 | 45,787 | 49,284 | 48,010 | 40,021 |
| 2013 | 39,760 | 37,783 | 49,941 | 39,673 | 47,624 | 39,749 | 43,485 | 45,258 | 44,443 | 41,252 | 47,778 | 48,047 |
| 2014 | 47,989 | 41,299 | 44,191 | 48,767 | 39,797 | 37,590 | 45,869 | 35,901 | 30,278 | 25,653 | 27,765 | 24,479 |
| 2015 | 26,356 | 24,128 | 29,641 | 31,121 | 36,328 | 30,797 | 27,115 | 24,061 | 23,463 | 29,836 | 32,057 | 38,991 |
| 2016 | 27,906 | 27,404 | 39,280 | 33,162 | 40,219 | 33,356 | 38,137 | 37,251 | 39,814 | 39,101 | 38,153 | 41,697 |
| 2017 | 44,601 | 39,436 | 40,327 | 41,795 | 43,013 | 33,102 | 36,917 | 23,614 | 22,352 | 25,911 | 30,016 | 26,999 |
| 2018 | 30,856 | 25,380 | 34,656 | 34,929 | 28,547 | 25,438 | 26,553 | 23,573 | 27,826 | 25,941 | 21,123 | 17,124 |
| 2019 | 17,549 | 16,200 | 14,146 | 12,879 | 14,131 | 11,571 | 12,151 | 8,249 | 12,850 | 6,261 | 7,629 | 14,604 |
| 2020 | 9,420 | 6,723 | 8,451 | 7,933 | 31,509 | 27,080 | 20,718 | 6,698 | 5,643 | 6,329 | 7,288 | 2,856 |
| 2021 | 4,705 | 3,977 | 7,004 | 7,783 | 7,765 | 10,061 | 10,954 | 7,694 | 8,301 | 6,783 | 10,932 | 10,641 |
| 2022 | 11,972 | 8,229 | 10,628 | 14,585 | 16,219 | 17,004 | 21,497 | 15,599 | 12,867 | 10,716 | 12,701 | 12,730 |
| 2023 | 12,829 | 16,065 | 12,636 | 13,232 | 8,885 | 9,680 | 11,513 | 12,483 | 11,199 | 8,721 | 7,356 | 11,287 |
| 2024 | 9,021 | |||||||||||
| - = No Data Reported; -- = Not Applicable; NA = Not Available; W = Withheld to avoid disclosure of individual company data. |
| Release Date: 3/29/2024 |
| Next Release Date: 4/30/2024 |