|
Download Data (XLS File) |
|
||||||||
|
||||||||
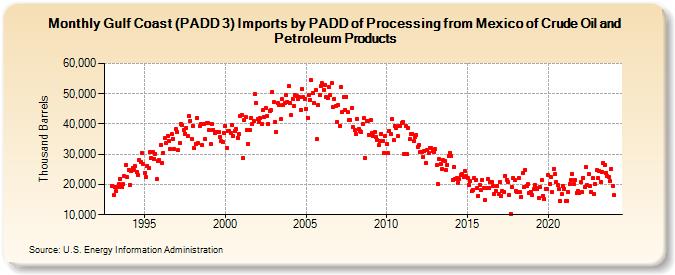
| Gulf Coast (PADD 3) Imports by PADD of Processing from Mexico of Crude Oil and Petroleum Products (Thousand Barrels) | ||||||||
| Year | Jan | Feb | Mar | Apr | May | Jun | Jul | Aug | Sep | Oct | Nov | Dec |
|---|---|---|---|---|---|---|---|---|---|---|---|---|
| 1993 | 19,524 | 16,372 | 19,129 | 17,700 | 19,239 | 20,200 | 21,902 | 19,321 | 20,050 | 22,862 | 26,429 | 22,328 |
| 1994 | 24,823 | 19,910 | 24,424 | 25,497 | 24,786 | 25,994 | 24,206 | 23,003 | 28,215 | 27,467 | 30,342 | 26,785 |
| 1995 | 23,822 | 22,390 | 26,190 | 25,608 | 30,573 | 28,704 | 30,697 | 28,546 | 30,163 | 21,728 | 27,878 | 28,108 |
| 1996 | 33,167 | 27,216 | 30,424 | 35,306 | 33,825 | 35,948 | 34,439 | 31,761 | 36,642 | 35,181 | 31,661 | 38,266 |
| 1997 | 37,277 | 31,293 | 33,754 | 39,851 | 39,574 | 38,046 | 36,790 | 38,734 | 35,915 | 42,714 | 41,077 | 35,100 |
| 1998 | 39,423 | 31,934 | 33,420 | 42,032 | 33,596 | 39,173 | 40,025 | 33,013 | 39,928 | 34,979 | 40,312 | 40,176 |
| 1999 | 37,943 | 33,337 | 40,033 | 38,077 | 37,145 | 37,367 | 37,464 | 37,355 | 35,710 | 34,271 | 33,881 | 37,174 |
| 2000 | 39,322 | 32,149 | 37,788 | 37,738 | 37,079 | 39,757 | 35,998 | 37,607 | 38,397 | 35,449 | 36,796 | 42,476 |
| 2001 | 43,090 | 28,620 | 41,462 | 42,280 | 37,909 | 33,466 | 38,132 | 42,062 | 40,102 | 40,945 | 49,790 | 46,804 |
| 2002 | 41,588 | 40,744 | 41,833 | 40,075 | 44,603 | 42,202 | 45,274 | 42,638 | 40,111 | 44,395 | 44,460 | 50,523 |
| 2003 | 47,116 | 40,656 | 37,504 | 46,779 | 46,109 | 41,504 | 48,164 | 46,138 | 46,892 | 49,438 | 47,344 | 52,527 |
| 2004 | 46,792 | 42,997 | 48,256 | 45,989 | 49,556 | 49,121 | 48,168 | 48,799 | 44,777 | 51,503 | 48,890 | 48,262 |
| 2005 | 45,046 | 42,136 | 49,659 | 48,075 | 54,482 | 50,271 | 47,008 | 51,295 | 34,874 | 46,247 | 49,669 | 52,450 |
| 2006 | 53,460 | 51,345 | 52,874 | 48,936 | 48,435 | 52,200 | 49,709 | 53,544 | 45,746 | 48,211 | 45,917 | 40,747 |
| 2007 | 46,332 | 39,425 | 52,094 | 43,974 | 48,917 | 44,730 | 49,071 | 43,827 | 41,241 | 41,283 | 45,333 | 38,854 |
| 2008 | 37,867 | 36,631 | 41,796 | 38,284 | 37,601 | 37,231 | 40,042 | 41,903 | 28,778 | 41,047 | 41,088 | 36,478 |
| 2009 | 41,409 | 36,984 | 36,011 | 37,387 | 35,855 | 34,766 | 33,027 | 34,378 | 36,847 | 34,524 | 30,460 | 36,069 |
| 2010 | 33,377 | 30,296 | 37,778 | 36,684 | 41,500 | 34,687 | 39,297 | 38,552 | 36,014 | 39,266 | 39,443 | 40,398 |
| 2011 | 40,799 | 30,026 | 39,255 | 29,926 | 38,654 | 34,869 | 36,620 | 36,746 | 34,227 | 35,793 | 36,326 | 32,403 |
| 2012 | 33,195 | 30,738 | 30,593 | 29,190 | 30,913 | 27,125 | 31,473 | 30,480 | 32,093 | 31,950 | 31,176 | 30,808 |
| 2013 | 31,665 | 26,411 | 20,013 | 28,367 | 26,700 | 25,224 | 27,959 | 27,924 | 24,772 | 26,598 | 29,423 | 30,532 |
| 2014 | 29,343 | 21,468 | 25,860 | 21,691 | 22,002 | 20,529 | 21,804 | 23,015 | 23,555 | 22,400 | 24,454 | 22,934 |
| 2015 | 22,187 | 19,982 | 20,982 | 17,746 | 18,126 | 22,141 | 21,498 | 18,787 | 16,212 | 19,941 | 18,195 | 21,601 |
| 2016 | 18,667 | 14,758 | 18,982 | 21,660 | 18,993 | 20,877 | 20,968 | 19,563 | 16,983 | 17,895 | 19,480 | 16,809 |
| 2017 | 20,919 | 16,251 | 17,697 | 17,601 | 22,908 | 21,597 | 20,686 | 16,371 | 10,357 | 19,097 | 22,215 | 21,328 |
| 2018 | 17,834 | 17,510 | 22,156 | 17,347 | 15,996 | 23,932 | 19,025 | 24,944 | 19,636 | 20,029 | 17,061 | 17,672 |
| 2019 | 16,408 | 18,392 | 19,956 | 18,875 | 18,494 | 15,452 | 19,041 | 21,388 | 16,283 | 15,117 | 18,651 | 18,438 |
| 2020 | 23,016 | 20,308 | 22,608 | 17,541 | 25,246 | 23,495 | 20,861 | 19,878 | 18,372 | 14,486 | 16,716 | 19,448 |
| 2021 | 18,593 | 14,606 | 14,645 | 17,386 | 20,092 | 21,601 | 23,392 | 20,138 | 21,430 | 17,193 | 17,869 | 17,119 |
| 2022 | 20,696 | 17,471 | 22,229 | 19,067 | 25,706 | 19,712 | 23,372 | 19,429 | 17,642 | 22,014 | 16,907 | 20,132 |
| 2023 | 24,669 | 21,994 | 24,557 | 20,971 | 24,257 | 27,101 | 26,329 | 23,850 | 22,824 | 22,558 | 21,029 | 25,208 |
| 2024 | 19,583 | |||||||||||
| - = No Data Reported; -- = Not Applicable; NA = Not Available; W = Withheld to avoid disclosure of individual company data. |
| Release Date: 3/29/2024 |
| Next Release Date: 4/30/2024 |