|
Download Data (XLS File) |
|
||||||||
|
||||||||
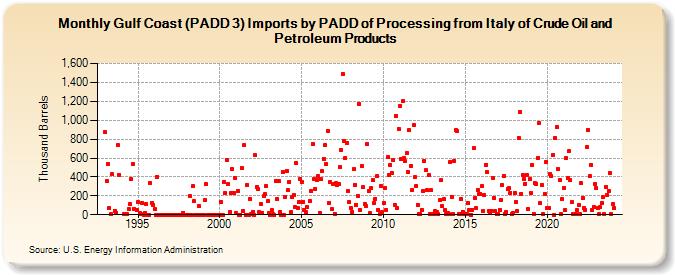
| Gulf Coast (PADD 3) Imports by PADD of Processing from Italy of Crude Oil and Petroleum Products (Thousand Barrels) | ||||||||
| Year | Jan | Feb | Mar | Apr | May | Jun | Jul | Aug | Sep | Oct | Nov | Dec |
|---|---|---|---|---|---|---|---|---|---|---|---|---|
| 1993 | 872 | 353 | 540 | 67 | 10 | 426 | 43 | 22 | 733 | 424 | ||
| 1994 | 9 | 3 | 62 | 115 | 377 | 535 | 65 | 45 | ||||
| 1995 | 134 | 23 | 9 | 125 | 0 | 21 | 118 | 0 | 0 | 334 | 128 | 105 |
| 1996 | 60 | 0 | 404 | 2 | 0 | 0 | 0 | 0 | 0 | 0 | 0 | 0 |
| 1997 | 0 | 0 | 0 | 0 | 0 | 0 | 0 | 0 | 0 | 21 | 0 | 0 |
| 1998 | 0 | 0 | 195 | 0 | 299 | 140 | 0 | 0 | 0 | 89 | 0 | 0 |
| 1999 | 0 | 152 | 322 | 0 | 0 | 0 | 0 | 0 | 0 | 0 | 0 | 0 |
| 2000 | 0 | 136 | 0 | 350 | 226 | 579 | 322 | 28 | 235 | 482 | 235 | 389 |
| 2001 | 14 | 254 | 0 | 0 | 498 | 35 | 736 | 0 | 318 | 0 | 169 | 7 |
| 2002 | 34 | 0 | 627 | 291 | 272 | 26 | 114 | 22 | 195 | 216 | 303 | 142 |
| 2003 | 19 | 0 | 49 | 7 | 0 | 360 | 164 | 355 | 24 | 0 | 454 | 0 |
| 2004 | 191 | 461 | 257 | 349 | 26 | 189 | 204 | 81 | 545 | 70 | 139 | 376 |
| 2005 | 346 | 138 | 54 | 27 | 83 | 144 | 247 | 750 | 377 | 274 | 365 | |
| 2006 | 405 | 23 | 374 | 461 | 589 | 736 | 532 | 888 | 128 | 348 | 59 | 326 |
| 2007 | 12 | 332 | 315 | 327 | 504 | 689 | 1,489 | 784 | 602 | 758 | 247 | 137 |
| 2008 | 69 | 30 | 483 | 319 | 108 | 201 | 1,175 | 49 | 514 | 289 | 116 | 87 |
| 2009 | 748 | 252 | 15 | 280 | 367 | 128 | 170 | 405 | 54 | 3 | 303 | 27 |
| 2010 | 125 | 279 | 55 | 611 | 421 | 531 | 445 | 575 | 108 | 1,049 | 67 | 908 |
| 2011 | 1,152 | 590 | 1,200 | 600 | 565 | 651 | 455 | 893 | 517 | 260 | 948 | 395 |
| 2012 | 305 | 105 | 6 | 6 | 54 | 250 | 570 | 470 | 258 | 422 | 7 | 257 |
| 2013 | 6 | 8 | 39 | 31 | 6 | 154 | 364 | 93 | 166 | 53 | 4 | 18 |
| 2014 | 6 | 562 | 191 | 6 | 573 | 891 | 882 | 3 | 5 | 166 | 34 | 10 |
| 2015 | 4 | 9 | 125 | 53 | 2 | 55 | 703 | 178 | 66 | 260 | 216 | 223 |
| 2016 | 299 | 41 | 210 | 529 | 448 | 37 | 13 | 39 | 391 | 179 | 37 | 3 |
| 2017 | 5 | 54 | 153 | 312 | 407 | 10 | 32 | 270 | 279 | 234 | 3 | 14 |
| 2018 | 230 | 139 | 40 | 813 | 1,085 | 220 | 417 | 377 | 328 | 422 | 61 | 376 |
| 2019 | 228 | 527 | 11 | 339 | 329 | 601 | 973 | 122 | 318 | 7 | 224 | 558 |
| 2020 | 70 | 70 | 435 | 410 | 636 | 2 | 811 | 932 | 482 | 371 | 4 | 164 |
| 2021 | 283 | 46 | 598 | 387 | 670 | 367 | 130 | 8 | 7 | 8 | 45 | 104 |
| 2022 | 3 | 332 | 179 | 69 | 52 | 720 | 897 | 406 | 531 | 46 | 84 | 327 |
| 2023 | 281 | 74 | 9 | 78 | 120 | 183 | 5 | 298 | 212 | 253 | 439 | 4 |
| 2024 | 112 | |||||||||||
| - = No Data Reported; -- = Not Applicable; NA = Not Available; W = Withheld to avoid disclosure of individual company data. |
| Release Date: 3/29/2024 |
| Next Release Date: 4/30/2024 |